Small Business Smiles
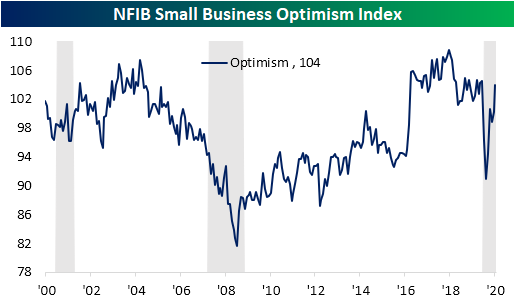
Sentiment among small businesses continued to improve in the month of September according to the NFIB’s monthly Small Business Optimism Index. As shown below, the index rose 3.8 points to 104 which is now just half of a point below the levels prior to the pandemic in February. That was also better than expectations of a smaller improvement to 101.2. Small business sentiment has now risen in four of the past five months.
In the table below, we break down this month’s report by each of the ten components of the headline number as well as the many other indices included in the report such as those not used as inputs to the headline number and what small businesses are reporting to be their biggest problems.
Across all indices of the September report, breadth was solid with only a couple of indices falling month over month—Expected Credit Conditions and Credit Conditions Availability. Some of those that were higher saw record or near-record month-over-month increases.
Some of the most notable indices this month included those regarding inventories. The Current Inventories index which gauges the net percent of owners viewing current inventory levels as too low rose 2 points to a record high reading of 5. Given this, the index for Plans to Increase Inventories is tied with the reading from November of 2004 for a record high of 11. Indicating low inventory levels, the report is consistent with some other recent data like the regional Fed manufacturing surveys. Those low inventories are resulting in higher prices as that index’s 12-point increase in September marked the biggest one month gain on record. While the Higher Prices index is not at any sort of an extreme, September’s move indicates that a rising number of businesses are raising prices.
Additionally, those higher prices and lower inventory numbers appear to be a result of demand that continues to rapidly improve. The indices for Actual Sales and Actual Earnings Changes remain negative for a sixth and tenth month in a row, respectively, meaning a net number of businesses continue to see lower rather than higher top and bottom-line numbers. But these indices are seeing big moves higher. For the index of Actual Earnings Changes, the 13-point climb in September was the largest on record and the 9-point increase for Actual Sales Changes followed a 13-point increase in August; both being some of the largest one-month moves on record. In order to meet the needs of this demand, a higher number of businesses plan to increase employment with that index rising to 28; the highest level since December of 2018. Even though businesses seek to hire more, they also report it is hard to fill positions as the index of Job Openings Hard to Fill rose to the top 5% of all readings. Cost and quality of labor also were reported as two of the most pressing problems for businesses. Click here to view Bespoke’s premium membership options for our best research available.


The Most Volatile Stocks on Earnings: Q3 2020
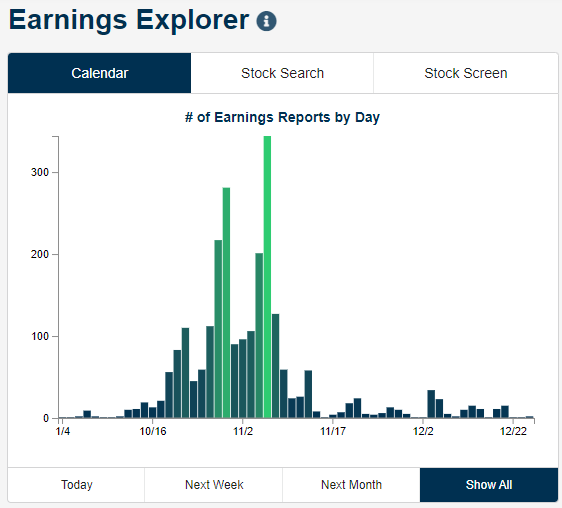
The Q3 earnings season began in earnest this morning with the first of the big banks (C and JPM) reporting. As shown below, the number of reports per day will get larger and larger over the next few weeks with the peak coming in the first week of November.
As we do at the start of each earnings season, below is our list of the most volatile stocks on earnings. These are stocks with at least ten years of quarterly earnings reports that have historically seen the biggest price moves on their earnings reaction days. (For a stock that reports after the close, its earnings reaction day is the next trading day’s change. For a stock that reports before the open, its earnings reaction day is that day’s change.)
As shown, Infinera (INFN) is the most volatile stock on earnings for those stocks with at least ten years of earnings reports. INFN has historically averaged a one-day change of +/-15% on its earnings reaction days. Stamps.com (STMP) ranks second with an average change of +/-13.5% on earnings, followed by Glu Mobile (GLUU) and Conn’s (CONN). Netflix (NFLX) ranks fifth on the list with an average one-day change of +/-12.29% on earnings. NFLX is by far the biggest stock on the list with sales estimates this quarter of $6.4 billion.
Other notables on the list of most volatile stocks include iRobot (IRBT), Overstock.com (OSTK), First Solar (FSLR), Align Tech (ALGN), and Booking Holdings (BKNG).
Most stocks on the list below don’t report earnings until later this month or in early November. Netflix (NFLX) and iRobot (IRBT) are the stocks on the list that will report first on October 20th.

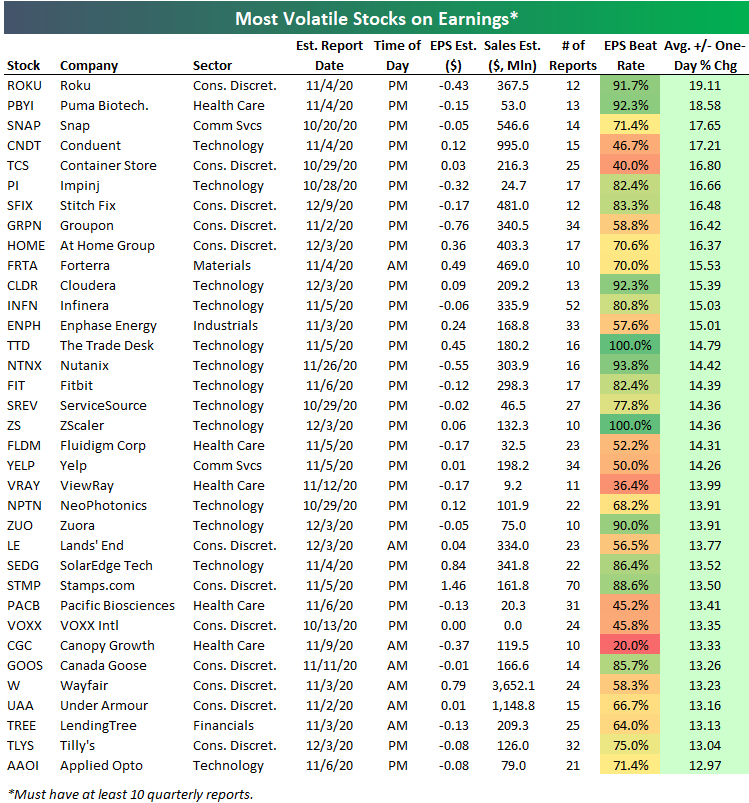
If we broaden our list to include stocks that only have at least 10 quarterly earnings reports, a lot of new names show up that haven’t been public for very long. At the top of the list below is Roku (ROKU) which has had 12 quarterly reports in its history. ROKU has historically averaged a one-day change of just under 20% (19.1%) on its earnings reaction day. It’s pretty incredible for a company to average a 20% swing in its market cap on one day every three months.
The first eleven stocks on the list below are not on the list above because they don’t have more than ten years worth of quarterly earnings data. These include names like Snap (SNAP), the Container Store (TCS), Stitch Fix (SFIX), Groupon (GRPN), and At Home Group (HOME). Other well-known stocks that normally see huge moves in reaction to earnings include Fitbit (FIT), Yelp (YELP), Canopy Growth (CGC), Canada Goose (GOOS), Wayfair (W), and Lending Tree (TREE). Try out our Earnings Explorer tool for free with a two-week trial to Bespoke Institutional.
B.I.G. Tips – Here Comes Earnings Season
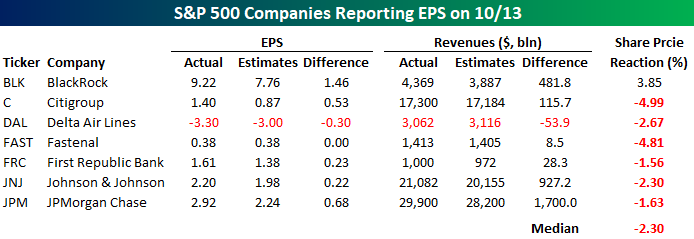
We’re thirteen days into the fourth quarter, but today was the first real day of earnings reports as a number of major banks and other firms in the S&P 500 reported Q3 earnings. As shown in the table below, of the seven S&P 500 companies that reported today, five topped EPS forecasts, and six out of seven reported better than expected revenues. The only disappointment relative to expectations was Delta (DAL) which missed both the top and bottom line. While the results have been positive relative to expectations, investors have mostly been selling the news. Of the seven companies that reported today, six are down on the day, and all of them are down at least 1.5%. All in all, the median performance of the seven stocks shown is a decline of 2.22%…not exactly a sign of upside surprise from the market.
What can we expect to see from the market as earnings season progresses? Make sure to check our quarterly preview of the upcoming earnings season for a look at how analyst sentiment tends to impact market performance during earnings season. For anyone with more than a passing interest in what to expect from the market during earnings season, make sure you check out this report. To see it, sign up for a monthly Bespoke Premium membership now!
Chart of the Day: What Do Strong Beat Rates Mean For Q3 Earnings?
Bespoke Stock Scores — 10/13/20
Bespoke’s Morning Lineup – 10/13/20 – Good First Impression
See what’s driving market performance around the world in today’s Morning Lineup. Bespoke’s Morning Lineup is the best way to start your trading day. Read it now by starting a two-week free trial to Bespoke Premium. CLICK HERE to learn more and start your free trial.
“Grow or die, that’s what I believed, no matter the situation.” – Phil Knight, Shoe Dog
With earnings season kicking off in earnest this morning, the above quote is probably the mantra of most CFOs of public companies. If you can’t show growth, kiss your stock price goodbye. Thankfully for the market this morning, the results we have seen so far as of this writing have been positive. With the exception of Fastenal (FAST), which reported inline EPS and AZZ, which missed revenue forecasts, every other company that has reported this morning has topped both EPS and revenue forecasts. Sure, it’s only eight companies, but it’s a good start.
Be sure to check out today’s Morning Lineup for a rundown of the latest stock-specific news of note, market performance in the US and Europe, major earnings releases, economic sentiment, trends related to the COVID-19 outbreak, and much more.

Outside of the US, emerging market equities have generally lagged the S&P 500, but in the recovery off the September lows, emerging market equities have the distinction of taking out their early September highs before the S&P 500. Not only that but just yesterday, the Emerging Market ETF (EEM) managed to also make a marginal new 52-week high as well. If it can build on those gains in the days ahead, the breakout will be confirmed.

Speaking of breakouts, EEM has essentially been range-bound for the better part of thirteen years. Since making an all-time high in 2007, EEM has seen multiple rallies to the low to mid-$50s area only to pull back. EEM closed yesterday at $46.23, so it’s nowhere near testing resistance at multi-year highs yet, but it’s something to keep on the radar. When and if it makes new highs in the months ahead, it will mark a notable long-term breakout more than a decade in the making.

Daily Sector Snapshot — 10/12/20
Big Banks Reporting This Week
The third quarter earnings season begins this week with the first of the big banks set to report tomorrow morning. One feature of our Earnings Explorer tool is an interactive earnings calendar with detailed information on stocks set to report earnings in the days, weeks, and months ahead. Below is a snapshot of the calendar showing expected earnings reports through Wednesday morning. Notably, Citigroup (C) and JP Morgan (JPM) will report tomorrow morning, while Bank of America (BAC), Goldman Sachs (GS), and Wells Fargo (WFC) will report on Wednesday morning.

You can dig deeper into individual stocks with our Earnings Explorer tool to see their historical earnings reports and how investors reacted. Below we show aggregate earnings snapshots for both Citigroup (C) and JP Morgan (JPM), which report tomorrow ahead of the open.
Notably, the Q3 earnings release for Citigroup has seen the stock average a one-day gain of 0.87% in reaction to the news. That’s a better share price response than any other quarter. Following its historical Q4 earnings releases, for example, Citi shares have been very weak with an average one-day decline of 2.39%.
While Q3 earnings have been okay for Citigroup in terms of share price reaction, it has been the worst quarter of the year for JP Morgan (JPM) historically. Over the last 19 years, JPM has averaged a one-day decline of 0.73% on its Q3 earnings reaction day with positive returns just 26% of the time.


Bank of America (BAC) has the worst numbers of the five big banks reporting this week when it comes to share price reactions to earnings. As shown below, the stock has averaged a decline of 1.03% on its 76 earnings reaction days since 2001 with positive returns just 42% of the time. Goldman Sachs (GS) has also struggled on earnings historically with its share price rising in reaction to the news just 39% of the time. Goldman’s Q3 report, however, has been a bit more bullish with the stock averaging a one-day gain of 0.44% in reaction to past third quarter earnings releases. Finally, Wells Fargo (WFC) is also set to release Q3 earnings on Wednesday, and the stock has only gained in reaction to past Q3 releases 32% of the time. Try out our Earnings Explorer tool for free with a two-week trial to Bespoke Institutional.
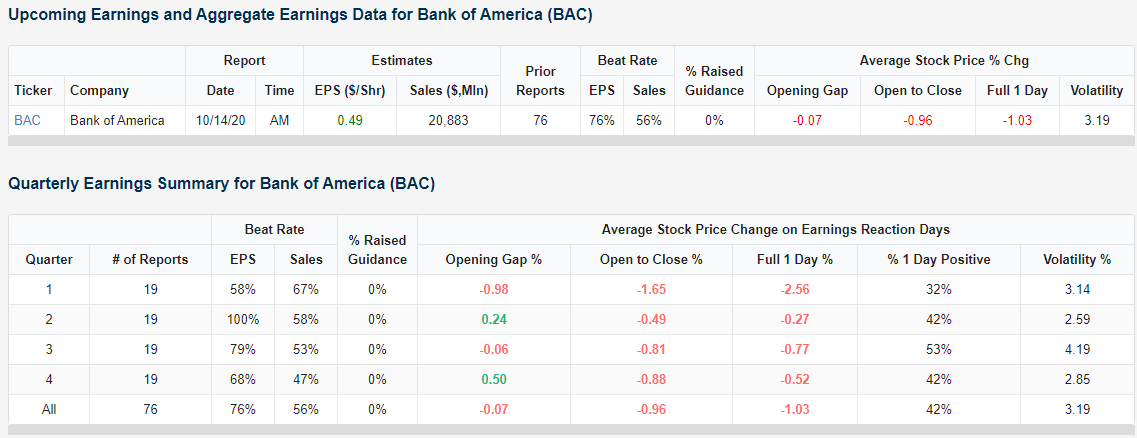
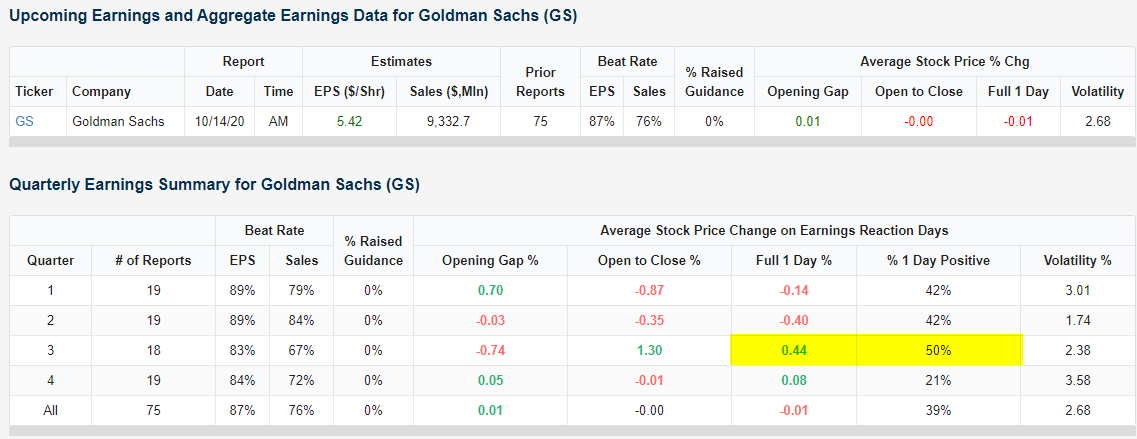

Chart of the Day: AAPL Performance After iPhone Reveals
“Meet the Nasdaq”
Tim Russert used to sign off from each week’s episode of Meet the Press with the tagline, “If it’s Sunday, it’s Meet the Press.” Borrowing from that phrase, the Nasdaq’s tagline might as well be “If it’s Monday, it’s Meet the Nasdaq.” With a gain of over 3% today, the Nasdaq is doing what it always does on Mondays – rally! The chart below shows the year-to-date performance of the Nasdaq so far in 2020 as well as its performance if you only owned the index on Mondays. Year to date, the Nasdaq is up an impressive 32.7%, putting it on pace for the first back-to-back annual gain of over 30% since 1998 and 1999. Even crazier, though, is the fact that the Nasdaq is up over 20% year-to-date on Mondays alone! The weekday that most people love to hate has been responsible for more than 60% of this year’s Nasdaq gain.
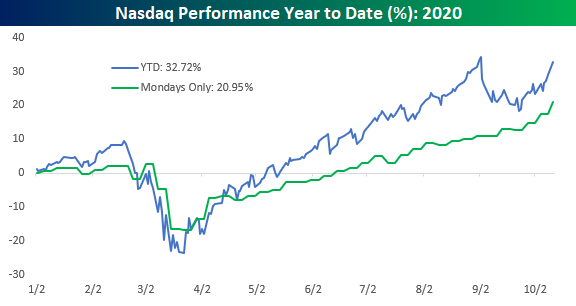
In the table below we summarize the performance of the Nasdaq by weekday so far in 2020. Monday’s average daily gain of 0.57% with gains more than 75% of the time is both the best average daily return and the most consistent to the upside. Tuesdays and Wednesdays haven’t been particularly bad for the Nasdaq either. Both days have seen an average one-day gain of 0.30% or more, and Wednesday has been positive three-quarters of the time. While the first three trading days of the week have been strong, Thursday and Friday have been days to forget. Although both days have also experienced positive returns more than half of the time, the average one-day change for both is negative resulting in declines on a cumulative. Thursday has been the weakest with a cumulative decline of 11.53% while Friday’s cumulative decline has been more modest at just 3.46%. TGIM. Click here to view Bespoke’s premium membership options for our best research available.
