B.I.G. Tips – Growing Triple Plays at a Discount
Chart of the Day – Obama and Trump: Two Peas in a Pod
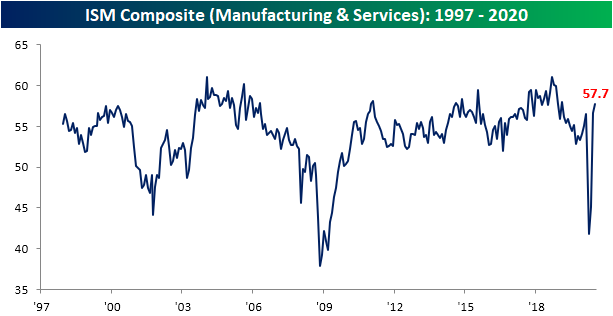
Services Soaring
Following Monday’s release of the ISM’s Manufacturing report for July, this morning the service counterpart was released. The report showed activity in the service sector continued to pick up with the headline number rising to 58.1 from 57.1 last month and expectations for a reading of 55.0. This month’s reading was the highest since February 2019 (58.5) and represented the first back to back expansionary readings (above 50) since February and March. That is also the highest level of the index since February of 2019 when it was at 58.5.
Much of the same applies to the combined reading of the service and manufacturing indices. With both the service and manufacturing readings rising in July, the composite of the two has now risen to 57.7; a second straight month of expansionary readings. That is also the strongest level of the composite since a reading of 58 in February 2019. For both the service and composite indices, the massive reversals higher since each ones’ respective low in April has also marked the biggest 3-month upticks on record. In other words, the broad economy is no longer contracting and continued to improve month over month in both June and July.

While the headline number was improved and most of the individual categories showed expansionary readings in July, not every index rose. There were only three sub-indices to swing higher in July: Business Activity, New Orders, and Backlog Orders. Every other one was lower with the indices for Employment and Export and Import orders even showing contractionary readings. Granted, with some nuance, not all of those declines are necessarily negatives for the economy. For example, the lower reading in Supplier Deliveries indicates that supply chains are normalizing as lead times become shorter. Additionally, the big drop in inventories indicates moderation in the massive inventory builds of the past few months.

While some areas of the survey fell MoM with a few even dipping into contractionary territory, the index for Business Activity was far from one of them. The index rose to 67.2 which is the highest reading on record outside of January of 2004 when it was just 0.5 points higher.

Part of that renewed outlook for business activity is thanks surging demand. In fact, the New Orders index surged 6.1 points (the ninth largest MoM increase on record) in July to a record high of 67.7. That means service sector businesses in July reported a record improvement in demand from the prior month. With an increase in New Orders, orders that were already in place are beginning to stack up. The index for Order Backlogs rose 4 points to 55.9. That is the highest reading since March of last year.


Whereas the past few months saw huge inventory builds as a result of plummeting demand, improved demand has led to a reversal of this in July. The index for inventories fell 8.7 points in July to 52. That was the second-largest MoM decline on record behind a 12.4 point drop back in March.

As previously mentioned, the decline in some areas of the survey like Inventories and Supplier Deliveries could actually be viewed as a positive. One area that does not apply is the index for employment which remains the weakest category of the service sector. After a substantial rebound last month (the biggest MoM increase on record), the Employment index reversed lower falling to 42.1 in July. While that is a small move relative to the past few months, it indicates further contractions in employment. July marked a fifth straight month in which Employment was in contraction. That’s the longest such streak since one that lasted from May of 2008 to June of 2010. Similar to the manufacturing index, while it could mean a reversal in the month ahead, at the moment that weak reading for the labor market stands in stark contrast with the improved demand picture.

As for the commentary section, it provided a bit more insight into employment as well as other areas. One comment noted the trend of remote work stating that roughly 95% of the company’s workforce is working remotely while another noted virtual meetings and the likes remain the norm. Another made mention that they were beginning to bring employees back to the workplace. With regards to demand, one company in the Utilities industry reported conditions appear to be at levels from before COVID-19. Meanwhile, one comment from the Construction industry reported strength in homebuilding which not only backs up recent macroeconomic data but should also bode well for that industry’s stocks. Click here to view Bespoke’s premium membership options for our best research available.

Big Moves Off 52-Week Lows
Within the US equity market, we’ve seen some major moves in individual stocks off their 52-week lows over the last few months. Look at the table below. Within the Russell 1000, which tracks the performance of the largest companies in the US, stocks in the index are up an average of 87.6% from their respective 52-week lows. Looking at performance by individual sectors, stocks in the Energy sector are up an average of 136.8%, while the average Consumer Discretionary stock has rallied 131.4%. The Technology sector wasn’t hit nearly as hard by the Covid-crash as other sectors, but stocks in the sector have doubled on an average basis relative to their 52-week lows. The only sector where stocks are up less than 50% on an average basis from their 52-week lows is Utilities at 46.33%.

For many investors, the holy grail of stock picking is the proverbial ten-bagger. A ten-bagger is a stock that multiplies by ten times its original price. Usually, this happens over the span of years, but in the Covid-economy, we’ve actually seen a number of these ten-baggers play out in the span of months. While most of these examples are in the small-cap space, shares of Wayfair (W), which has a current market cap of $27.5 billion, have rallied from $21.70 on March 19th to its current price of $290.85 now. That’s a gain of more than 1,200% in less than five months!
Within the entire Russell 1,000, 257 stocks have at least doubled off their 52-week lows, and in the table below we highlight the 34 stocks that are at least a quarter of the way to the ten-bagger club and have rallied more than 250%. As mentioned above, W tops the list, but Fastly (FSLY), which has barely been public for a year, is just shy of the club with a gain of 992%. Behind FSLY, Livongo Health (LVGO) is up 855%. Given that LVGO just got a takeover offer from Teladoc (TDOC), the 11th best-performing stock on the list, it may only make the ten-bagger club under the banner of the TDOC ticker.
In looking through the list of stocks shown, many of these names come from the Health Care, Technology, and Consumer Discretionary sectors and have been direct beneficiaries of the new Covid-economy. At the same time, six stocks from the Energy sector made the list as well as they recovered from their bombed-out levels after oil prices briefly traded in negative territory earlier this year. Like what you see? Click here to view Bespoke’s premium membership options for our best research available.

Bespoke’s Morning Lineup – 8/5/20 – Lucky 13 For Gold
See what’s driving market performance around the world in today’s Morning Lineup. Bespoke’s Morning Lineup is the best way to start your trading day. Read it now by starting a two-week free trial to Bespoke Premium. CLICK HERE to learn more and start your free trial.
Quote of the Day: “There is a time to go long, a time to go short, and a time to go fishing.” – Jesse Livermore
Markets are set up for another positive day as US equity futures are firmly in positive territory following some strong economic data out of Europe that followed a weak Services PMI reading out of China. The ADP Private Payrolls report for July was just released and came in well short of expectations, rising 167K compared to forecasts for a gain of 1.2 million. That’s a pretty big miss, but this employment data has been pretty difficult to forecast lately.
Be sure to check out today’s Morning Lineup for a rundown of the latest stock-specific news of note, key earnings and economic news in Europe and the US, trends related to the COVID-19 outbreak, and much more.

Gold is trading up over 1% this morning and putting the $2,000 level further in the rearview mirror. Today’s gain represents the 13th positive day for gold in the last 14 trading days as investors rotate into the asset class as a store of value.
In a world that has gone increasingly digital in the last several years, bitcoin has served as a form of digital gold. In the last year, though, bitcoin hasn’t done nearly as well as physical gold. As shown in the chart below, the front-month gold contract is up nearly 40% over the last year while bitcoin is barely unchanged.

Chart of the Day: Aerovironment Flying High
Bespoke Stock Scores — 8/4/20
Bespoke’s Morning Lineup – 8/4/20 – Stale Breadth
See what’s driving market performance around the world in today’s Morning Lineup. Bespoke’s Morning Lineup is the best way to start your trading day. Read it now by starting a two-week free trial to Bespoke Premium. CLICK HERE to learn more and start your free trial.
Quote of the Day: “Wall Street sells stocks and bonds but what it really peddles is hope.” – Jason Zweig
We have a quiet day of economic data to contend with, but there should be plenty of drama concerning the ongoing discussions in DC over additional stimulus. Futures have been drifting lower all morning after peaking right before the European open. Earnings news continues to impact individual stocks as the overall market reaction to these reports has been positive.
Be sure to check out today’s Morning Lineup for a rundown of the latest stock-specific news of note, key earnings and economic news in Europe and the US, trends related to the COVID-19 outbreak, and much more.
The S&P 500 traded to its highest levels since February yesterday, but one breadth measure uncharacteristically lagged. As shown in the chart below, the S&P 500’s cumulative A/D line hasn’t made a new high since 7/22. While it’s nowhere near breaking down at his point, it is a trend worth highlighting as this measure has consistently led price over the last few years.

Daily Sector Snapshot — 8/3/20
Bespoke Market Calendar — August 2020
Please click the image below to view our August 2020 market calendar. This calendar includes the S&P 500’s average percentage change and average intraday chart pattern for each trading day during the upcoming month. It also includes market holidays and options expiration dates plus the dates of key economic indicator releases. Start a two-week free trial to one of Bespoke’s three research levels.
