B.I.G. Tips — Retail Sales Rock to New Highs
At the headline level, July’s Retail Sales report disappointed as the reading missed expectations by nearly a full percentage point. Just as soon as the report was released, we saw a number of stories pounce on the disappointment as a sign that the economy was losing steam. Looked at in more detail, though, the July report wasn’t all that bad. While the headline reading rose less than expected (1.2% vs 2.1%), Ex Autos and Ex Autos and Gas, the results were much better than expected. Not only that, but June’s original readings were all revised higher by around a full percentage point.
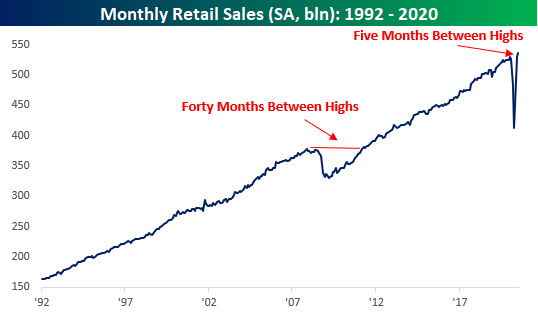
Besides the fact that this month’s report was better underneath the surface and June’s reading was revised higher, it was also notable as the seasonally-adjusted annualized rate of sales in July hit a new record high. After the last record high back in January, only five months passed until American consumers were back to their pre-Covid spending ways. For the sake of comparison, back during the Financial Crisis, 40 months passed between the original high in Retail Sales in November 2007 and the next record high in April 2011. 5 months versus 40? Never underestimate the power of the US consumer!
While the monthly pace of retail sales is back at all-time highs, the characteristics behind the total level of sales have changed markedly in the post COVID world. In our just released B.I.G. Tips report we looked at these changing dynamics to highlight the groups that have been the biggest winners and losers from the shifts. For anyone with more than a passing interest in how the COVID outbreak is impacting the economy, our monthly update on retail sales is a must-read. To see the report, sign up for a monthly Bespoke Premium membership now!
Bespoke’s Morning Lineup – 8/14/20 – Meet the New Boss, Same as the Old Boss
See what’s driving market performance around the world in today’s Morning Lineup. Bespoke’s Morning Lineup is the best way to start your trading day. Read it now by starting a two-week free trial to Bespoke Premium. CLICK HERE to learn more and start your free trial.
“If most traders would learn to sit on their hands fifty percent of the time, they would make a lot more money.” – Bill Lipschutz
It’s not looking like a positive finish to the week for stocks as Thursday’s modest losses for the S&P 500 look set to continue today. Data overnight from China in the form of Industrial Production and Retail Sales were both weaker than expected. In Europe, Q2 GDP dropped 12.1%, which was in line with expectations while Employment declined 2.8% y/y. One bright spot is that futures are currently well off their lows from 5 AM (all times eastern).
In the US today, we also have a ton of data to contend with starting off with Retail Sales (mixed, headline missed but Control Group better than expected) , Non-Farm Productivity, and Unit Labor Costs at 8:30 (both much higher than expected). Then, at 9:15, we’ll get Industrial Production and Capacity Utilization, followed by Business Inventories and Michigan Sentiment at 10 AM. So, depending on how these reports come in, should shape how we finish the week.
Be sure to check out today’s Morning Lineup for a rundown of the latest stock-specific news of note, market performance in the US and Europe, trends related to the COVID-19 outbreak, and much more.

We’ve long been advocates that the days where the importance of transports acting as a leading indicator for the broader market have given way to the semis acting as the new transports of the digital 21st century. Lately, though, it hasn’t mattered which group you track. The chart below shows the relative strength of the DJ Transports and the Philadelphia Semiconductor Index versus the S&P 500 over the last year. For each index, a rising line indicates outperformance versus the S&P 500 while a falling line indicates underperformance. From late 2019 through this past Spring, the two indices moved in opposite directions from each other as semis trended higher, and transports lagged the market. Beginning in May, though, the Transports bottomed out and have started to outperform. With both indices now trending higher versus the market, it seems to be sending a signal that both the physical and digital economies are on the mend.
On a side note, it’s interesting to note that when all hell was breaking loose in the market in March, both the transports and semis saw their relative strength improve heading into the March 23rd low.

Bespoke Fox Business Appearance (8/13)
Bespoke co-founder Paul Hickey appeared on Fox Business Network’s “Making Money With Charles Payne” on 8/13 to discuss the election and stock splits. To view the segment click on the image below. Start a two-week free trial to Bespoke Institutional for full access to all of our research and interactive tools.

The Bespoke 50 Top Growth Stocks — 8/13/20
Every Thursday, Bespoke publishes its “Bespoke 50” list of top growth stocks in the Russell 3,000. Our “Bespoke 50” portfolio is made up of the 50 stocks that fit a proprietary growth screen that we created a number of years ago. Since inception in early 2012, the “Bespoke 50” has beaten the S&P 500 by 164.1 percentage points, which hit a new high this week. Through today, the “Bespoke 50” is up 309.0% since inception versus the S&P 500’s gain of 144.9%. Always remember, though, that past performance is no guarantee of future returns. To view our “Bespoke 50” list of top growth stocks, please start a two-week free trial to either Bespoke Premium or Bespoke Institutional.

Bespoke’s Weekly Sector Snapshot — 8/13/20
Chart of the Day: Is the Market Pricing In Uncertainty on the Election Outcome?
Near Record Highs Brings Some Bulls Back
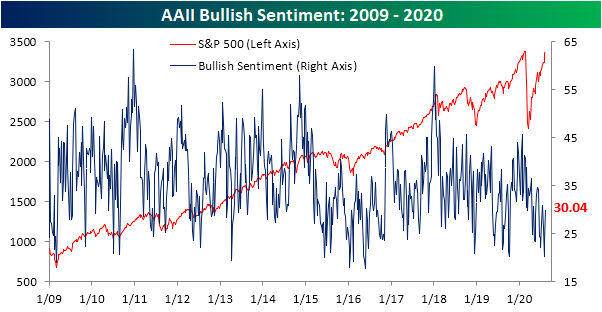
The S&P 500 has pressed ever closer to a new all-time high, but as we noted last week, sentiment remains fairly muted. Historically, when the S&P 500 has been at or within 1% of an all-time high bullish sentiment has sat around an average of 40%. Bearish sentiment, on the other hand, has typically been around 25.5%. With the S&P 500 less than a tenth of a percent away from its February 19th closing high today, bullish sentiment from AAII stands at 30.04%; roughly 10 percentage points away from what could be expected when the S&P 500 is so close to an all-time high. Although bullish sentiment is lower than might be normal for where the S&P trades, it did pick up considerably week over week, rising 6.75 percentage points in what was the largest single weekly increase since March 5th when it rose by 8.31 percentage points. Even after that increase, though, bullish sentiment was higher less than a month ago (July 16th).
Again, historically bearish sentiment has only been just over 25% when the S&P 500 is close to all-time highs. That is far from the case today as 42.12% of respondents in AAII’s survey reported as bearish. Conversely to bullish sentiment, though, bearish sentiment fell 5.48 percentage points. That was the largest week over week decline since May 21st’s 5.59 percentage point decline, leaving bearish sentiment at its lowest level since June 11th.

Those moves in bullish and bearish sentiments led the bull-bear spread to be cut in half, rising from -24.31 to -12.08. That is the most the spread has climbed in a single week since February when it rose from -1.35 to 14.93. Despite that large move, the spread still favors bears as the record streak of negative readings lives on. The bull-bear spread is now at its highest reading since June 11th.

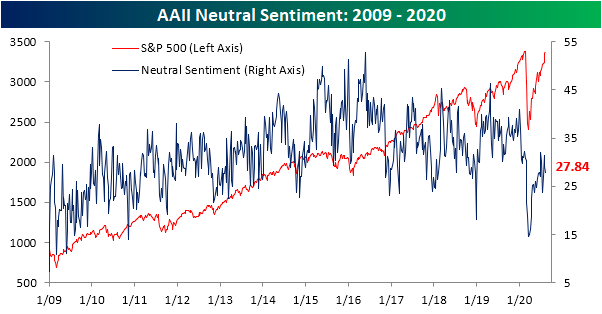
Meanwhile, neutral sentiment was slightly lower, dropping 1.27 percentage points to 27.84%. That only leaves it at its lowest level since July 23rd. Start a two-week free trial to Bespoke Institutional to access our interactive economic indicators monitor and much more.
The Strangest Top 25 List In Some Time
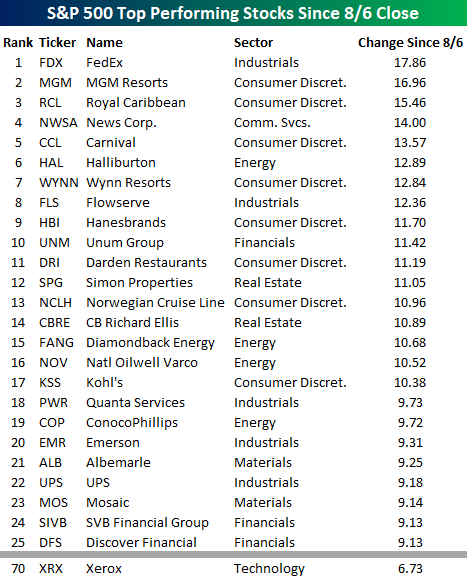
Look closely at the list of the top 25 performing S&P 500 stocks since last Thursday’s close and tell us what’s wrong with it? Do you see it? Keep looking, you’ll figure it out. Yup. That’s it! Not a single one of the 25 best performing stocks over the last week is from the Technology sector. In looking through the list of names, it’s littered with stocks that were left for dead at varying points in the last several months. FedEx (FDX) is up nearly 18%. Casinos and cruise ships have been collecting dust and rust for the last five months, but the stocks of MGM and Royal Caribbean (RCL) are the second and third best-performing stocks in the S&P 500 over the last week.
Not only are there no stocks from the Technology sector in the top 25, but there aren’t even any in the top 50. To find a Tech sector stock on the list, you have to go all the way down to spot number 70 where Xerox (XRX) sits with its gain of 6.73%. Yeah. We were surprised too. Not only is XRX still a public company, but it’s considered a tech stock.
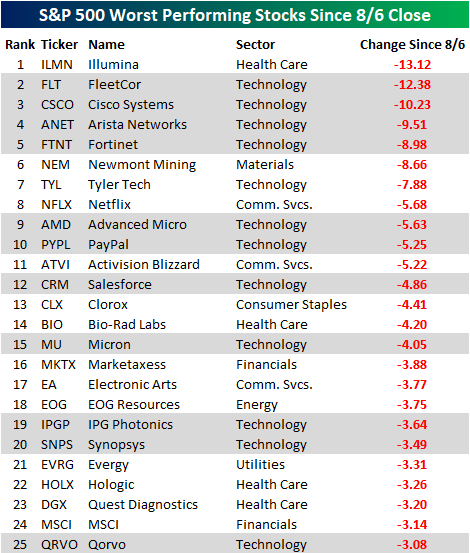
If you want to find a lot of stocks from the Technology sector, they are on the list of the 25 worst performers since last Thursday. Of the 25 names listed below, 12 are from the Technology sector. Not only that, but even many of the non-tech stocks listed like Illumina (ILMN), Netflix (NFLX), Activision Blizzard (ATVI), Marketaxess (MKTX), Electronic Arts (EA), and Hologic (HOLX) have very high tech characteristics behind their businesses. Like what you see? Start a two-week free trial to Bespoke Institutional for full access to our research and interactive tools.
Jobless Claims Finally Below 1 Million
This morning’s release of initial jobless claims marked the first time that claims were below 1 million since the week ending March 13th (21 weeks). Jobless claims fell 228K to 963K compared to expectations of a much smaller drop to only 1.1 million from 1.19 million last week. This week’s 228K decline was a slightly smaller drop than the prior week’s 244K decline but remains a much larger improvement than what was observed through most of June and July. Overall, claims are certainly on the right track with the first sub-1 million milestone now in the bag, but the 963K initial claims filed in the past week is still a historically elevated level higher than anything observed prior to the pandemic.

On a non-seasonally adjusted basis, this was actually the second week that claims were below 1 million with last week’s reading of 988.3K and this week’s 831.9K. This decline comes with the seasonal tailwind that claims typically decline from early July through September.

Continuing claims are echoing the continued improvements in labor data with another decline of 604K this week bringing the seasonally adjusted number to 15.486 million. That leaves continuing claims at the lowest level since the first week of April. Again, as is the case with initial claims, continuing claims remain historically high but are headed in the right direction.

Not only is the headline number of claims improving but so are claims for Pandemic Unemployment Assistance (PUA). Initial claims by this measure fell from 0.66 million to 0.49 million this week. These are some of the lowest readings since the program began in mid-April. That brings the total between NSA claims and PUA claims to 1.32 million. While lagged an additional week, continuing claims for the week ending July 24 (26.6 million) were the lowest since April 24th, and for PUA claims in particular, it was the lowest reading since the end of May. Start a two-week free trial to Bespoke Institutional to access our interactive economic indicators monitor and much more.

Bespoke’s Morning Lineup – 8/13/20 – Jobs in the Spotlight
See what’s driving market performance around the world in today’s Morning Lineup. Bespoke’s Morning Lineup is the best way to start your trading day. Read it now by starting a two-week free trial to Bespoke Premium. CLICK HERE to learn more and start your free trial.
Time is the friend of the wonderful company, the enemy of the mediocre.” – Warren Buffett
For the first time in 21 weeks, jobless claims dropped below a million (963K), which was below consensus forecasts for 1.1 million. Continuing claims also came in lower than expected but by a narrower margin. 963K is still high by all historical comparisons outside of the last several months, but it indicates a continuation of a move in the right direction. Regarding stimulus talks, if it was going to take a sense of urgency to get Democrats and Republicans to come to an agreement, the stock market trading right near record highs and jobless claims back below a million aren’t providing any ammunition.
Be sure to check out today’s Morning Lineup for a rundown of the latest stock-specific news of note, market performance in the US and Europe, new FHFA fees on mortgage refinancings, trends related to the COVID-19 outbreak, and much more.
Small caps have been outperforming large gaps in recent weeks off the March lows after the Russell 2000 was decimated during the COVID crash. Over just the last week, the Russell 2000 has outperformed the S&P 500 by nearly a full percentage point, but as shown in the chart below, the index still has some catching up to do. Besides the fact that small caps saw their peak relative to large caps earlier in the last decade, they have only erased barely more than half of the underperformance they saw from the S&P 500’s February peak to March trough.
