Bespoke Stock Scores — 12/1/20
Bespoke Market Calendar — December 2020
Please click the image below to view our December 2020 market calendar. This calendar includes the S&P 500’s average percentage change and average intraday chart pattern for each trading day during the upcoming month. It also includes market holidays and options expiration dates plus the dates of key economic indicator releases. Start a two-week free trial to one of Bespoke’s three research levels.
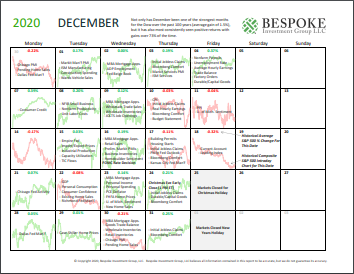
Chart of the Day: December Intra-Month Returns
November 2020 Headlines
Stocks and Bonds Both in Rally Mode
When it comes to equity market performance in a given month, it doesn’t get much better than November. While the S&P 500’s total return of 10.95% in the month was only the second-best monthly performance of the year, it was still enough to rank as the third-best month for the S&P 500 in the last thirty years and just the ninth month since 1980 that it was up 10%+.
The chart below shows the S&P 500’s annualized total return over the last one, two, five, ten, and twenty years and compares the current returns to the historical average. For the last year, the S&P 500’s total return has been 17.5% which is nearly six full percentage points higher than the historical average. For the last two years, the annualized return has been nearly as strong at 16.8%, and it is actually even stronger relative to the historical average of 10.5%. Moving further out the time horizon, the S&P 500’s annualized returns drift lower, and while the five and ten-year annualized returns are greater than average, the S&P 500’s annualized gain of 7.3% in the last 20 years is more than 3.5 percentage points below the historical average of 10.9%.

The last couple of years haven’t just been strong for equities. Over the last year, long-term US Treasuries, as measured by the Merrill Lynch 10+ Year US Treasury Index, have rallied 15.7%, which is more than six full percentage points greater than the historical average of 9.5%. Over the last two years, returns have been even stronger with an annualized gain of nearly 20%, or more than double the historical average of 9.1%! While the last two years have been strong for US Treasuries, the last five, ten, and twenty years have all seen returns of between one and two percentage points below their historical average.

Lately, when you see rallies in the equity market, it tends to be accompanied by a decline in treasuries as yields rise. In November, though, that wasn’t the case. Even with the S&P 500 up 10.95%, long-term US Treasuries rallied just over 1%. So how uncommon is it for stocks to rally like they did in November while bonds also rally. Actually, it is not very uncommon at all. The table below shows the nine months since 1980 where the S&P 500’s total return in a given month was 10% or more, and of those months, long-term treasuies also rallied in every month but one (October 2011). Click here to view Bespoke’s premium membership options for our best research available.

Bespoke’s Morning Lineup – 12/1/20 – Stronger Data Boosts Futures
See what’s driving market performance around the world in today’s Morning Lineup. Bespoke’s Morning Lineup is the best way to start your trading day. Read it now by starting a two-week free trial to Bespoke Premium. CLICK HERE to learn more and start your free trial.
“I believe you have to be willing to be misunderstood if you’re going to innovate.“ – Jeff Bezos
Futures are picking up in December right where they left off November as the S&P 500 is indicated to open up just about 1%. Besides just the near-constant bid to the market these days, other factors behind today’s move include a rally in European equities and generally positive economic data out of Asia and Europe.
Be sure to check out today’s Morning Lineup for updates on the latest market news and events, economic data out of Asia and Europe, an update on the latest national and international COVID trends, and much more.

With a gain of 10.75%, the S&P 500 just had its best November since 1928 when the index rose 11.99%. But while it was the best November in more than 90 years, it wasn’t even the best month of 2020 as April’s 12.68% gain still holds that lead.
As we noted at the start of the month, November has historically been a good month from a seasonal perspective. The same is true for December as shown in our monthly seasonality snapshot below. Over the last 100 years, the Dow has averaged a gain of 1.43% with positive returns 73% of the time. Over the last 50 years, the Dow has averaged a gain of 1.51% with positive returns 70% of the time. And over the last 20 years, the Dow has averaged a gain of 0.84% with positive returns 65% of the time.

Daily Sector Snapshot — 11/30/20
B.I.G. Tips – December 2020 Seasonality
Lone Star Slowing
The fifth and final regional Fed index for November came out of the Lone Star State today. The index was expected to show expansionary, but decelerating activity in the month of November. The results were just that as the headline number fell from 19.8 in October down to 12 which was a bit weaker than the expected decline to 14.3. Although a slower rate of growth, activity has continued to expand and the index still at some of the highest levels of the past two years.

Similar to the other manufacturing reports from the other districts released this month, under the hood things were pretty mixed. All but one index (Finished Good Inventories) has continued to be consistent with further growth, but more than half of those indices declined this month, That means activity has generally continued to expand, but at a slower pace than last month. For some components like New Orders and Production, the deceleration was significant while employment metrics held up better.
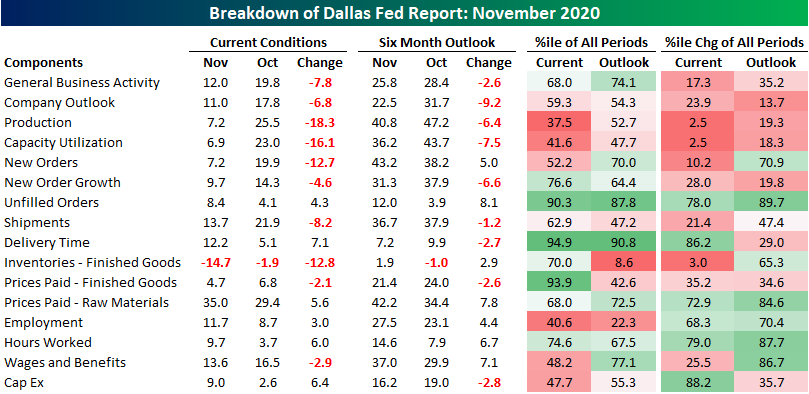
In November, New Orders continued to grow as the index remained positive at 7.2. While that is still indicative of overall growth in new orders, it also marks a significant deceleration from October when the reading was 19.9. Given this, the index for New Orders Growth Rate likewise fell to 9.7 from 14.3.

The indices for Capacity Utilization and Production saw even more dramatic declines. The month over month declines for both indices were in the respective bottom 2.5% of all monthly changes. With Capacity Utilization at 6.9 and Production at 7.2, this month’s readings were still indicative of the district’s firms increasing output for six months in a row.
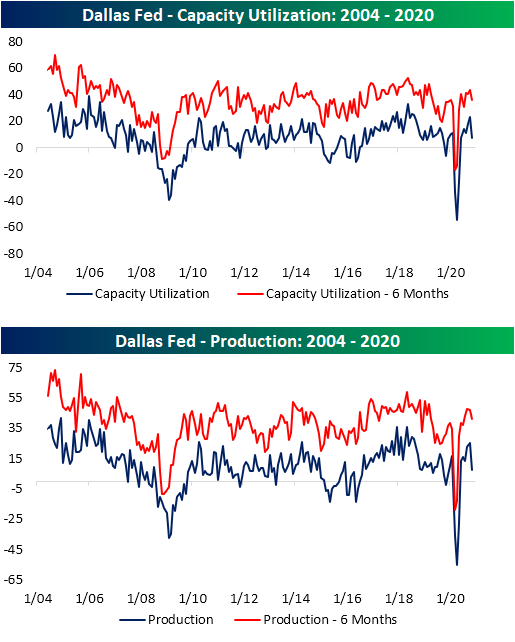
Even though production overall has continued to pick up, inventories continue to decline at a rapid pace. The index for Finished Good Inventories fell sharply this month, dropping from -1.9 to -14.7. Outside of August’s low of -17.3, that is the lowest level since January of 2010.

As inventories drawdown at one of the most rapid paces of the past decade, lead times have risen. The index for Delivery Time bounced back in November after a decline in October. At 12.2, the index is now at the highest level since the summer of 2018. That is also nearly in the top 5% of all readings in the survey’s history. Click here to view Bespoke’s premium membership options for our best research available.

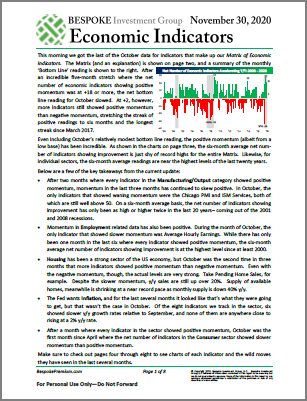
Bespoke Matrix of Economic Indicators – 11/30/20
Our Matrix of Economic Indicators is the perfect summary analysis of the US economy’s momentum. We combine trends across the dozens and dozens of economic indicators in various categories like manufacturing, employment, housing, the consumer, and inflation to provide a directional overview of the economy.
To access our newest Matrix of Economic Indicators, start a two-week free trial to either Bespoke Premium or Bespoke Institutional now!