Bespoke’s Morning Lineup – 10/1/20 – Is This Thing On?
See what’s driving market performance around the world in today’s Morning Lineup. Bespoke’s Morning Lineup is the best way to start your trading day. Read it now by starting a two-week free trial to Bespoke Premium. CLICK HERE to learn more and start your free trial.
“However beautiful the strategy, you should occasionally look at the results.” – Winston Churchill
Japanese equities were unexpectedly halted for the day due to a trading glitch, but European and US equities are trading on the positive side of unchanged. US equities are indicated higher by more than half of a percent ahead of a very busy day of economic data and optimism over a new round of stimulus. How many times can the market rally on the same rumor?
Initial Claims are expected to come in roughly unchanged from last week while Continuing Claims are expected to drop modestly. Both Personal Income and Spending, on the other hand, aren’t expected to show nearly as much strength as their prior readings. Finally, the Markit US Manufacturing and ISM Manufacturing PMIs are expected to show small improvements versus August’s readings.
Be sure to check out today’s Morning Lineup for a rundown of the latest stock-specific news of note, market performance in the US and Europe, Markit Manufacturing data from around the world, trends related to the COVID-19 outbreak, and much more.

The first big economic report of the month will be the ISM Manufacturing report at 10 AM eastern. Already, we have seen signs of strength in the manufacturing sector based on the positive regional Fed manufacturing surveys, but one of the most closely correlated indices to the ISM Manufacturing report is the Chicago PMI. As noted in last night’s Closer report, the r-squared of the monthly levels for each report is 0.76. Based on the results of yesterday’s release which came in well above expectations (62.4 vs 52.0) and was the strongest relative to expectations since October 2013, today’s ISM Manufacturing report should be positive as well. Even with this month’s increase, though, the Chicago PMI remains well below its peak levels of the prior expansion.

Adding together July’s strong gain, a modest decline in August, and now September’s surge, the Chicago PMI has seen its largest three-month increase in the history of the survey. With a gain of 25.78 points during that period, the only other period that was even close in terms of the magnitude of the gain was exactly 40 years ago in the three-months ending September 1980 (+24.29). Looking at the chart, what’s notable about September 1980 and many of the other large three-month rallies in this index is that they occurred right in the early stages of an economic expansion. That’s the good news. The one but, and there’s always a but, is that the 1980 period, which was the period with the most similar three-month increase to now, was quickly followed by another recession. Let’s hope we don’t see double-dip this time around too.

The Bespoke 50 Top Growth Stocks — 10/1/20
Every Thursday, Bespoke publishes its “Bespoke 50” list of top growth stocks in the Russell 3,000. Our “Bespoke 50” portfolio is made up of the 50 stocks that fit a proprietary growth screen that we created a number of years ago. Since inception in early 2012, the “Bespoke 50” has beaten the S&P 500 by 158.8 percentage points. Through today, the “Bespoke 50” is up 302% since inception versus the S&P 500’s gain of 143.2%. Always remember, though, that past performance is no guarantee of future returns. To view our “Bespoke 50” list of top growth stocks, please start a two-week free trial to either Bespoke Premium or Bespoke Institutional.

Daily Sector Snapshot — 9/30/20
B.I.G. Tips — S&P 500 October Intra-Month Seasonality
Bespoke Market Calendar — October 2020
Please click the image below to view our October 2020 market calendar. This calendar includes the S&P 500’s average percentage change and average intraday chart pattern for each trading day during the upcoming month. It also includes market holidays and options expiration dates plus the dates of key economic indicator releases. Start a two-week free trial to one of Bespoke’s three research levels.

What Have Democratic Sweeps Meant for the S&P 500?
Headed into the first presidential debate Tuesday night, betting markets (ElectionBettingOdds.com) placed Democratic candidate Joe Biden as the slight favorite to take the White House in November. The debate resulted in Biden gaining another 5 percentage point chance of winning the Presidency. As of this morning, Biden’s odds to win are at 59.8% versus Trump’s odds of 38.9%. Additionally, Democrats are slight favorites to win control of the Senate (58.4% to 41.5%) and big favorites to maintain the House (82.8% to 17.1%). Given these odds, in the chart below we show the average performance of the S&P 500 from the three months before Election Day through three months after Election Day for all election years post-WWII that resulted in a sweep of the executive and legislative branch by the Democrats.
As shown, on average the S&P 500 has been on the decline in the weeks leading up to Election Day, though in the days just before the Election there has been a small rally that sharply reverses once the results come in. After the initial post-Election drop, the market has trended a bit higher, but by three months after the Election, it has only found itself around the same levels as Election Day; on average a 2.6% loss versus where the index stood three months prior.
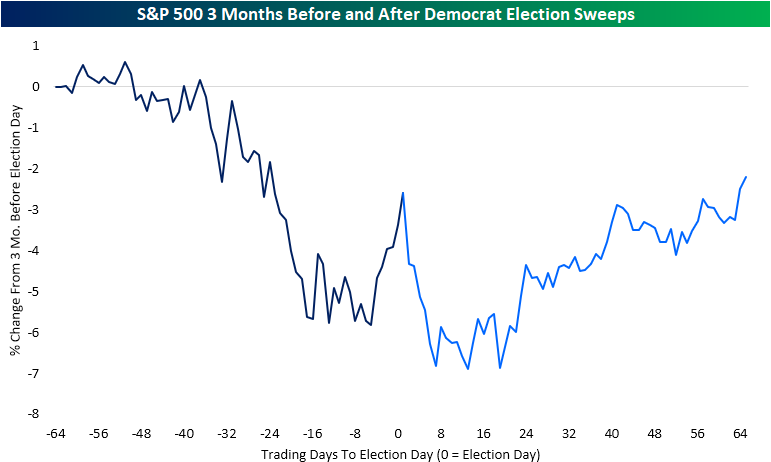
The composite shown above is comprised of six different years: 1948, 1960, 1964, 1976, 1992, and 2008. While on average the S&P 500 has traded lower, it is not necessarily a sure-fire thing. For example, 1948 and 2008 were the only years that saw the S&P 500 trade and stay significantly lower in the wake of the election. In 1976, there was similarly a sell-off in the immediate aftermath of the election, but the index did make its way back up to the highs of that six-month time frame later on albeit no new high was put in place. Meanwhile, 1960, 1964, and 1992 all saw the S&P 500 run higher after the election even despite some periods of consolidation after initial moves higher. In our B.I.G. Tips report from Tuesday, we show these same charts for all Presidential election years post WWII including a look at the average performance given every potential election outcome. Click here to see the report with a two-week free trial to Bespoke Premium.

Bespoke CNBC Appearance (9/29)
Bespoke co-founder Paul Hickey appeared on CNBC’s Closing Bell on Tuesday to discuss various market topics including the impact of the dollar on the performance of large-cap stocks. To view the segment, click the image below. Click here for a free trial to Bespoke’s research offerings and gain instant access to our latest market thoughts.

Chart of the Day: Third Time the Charm?
Bespoke’s Morning Lineup – 9/30/20 – They Did it Again
See what’s driving market performance around the world in today’s Morning Lineup. Bespoke’s Morning Lineup is the best way to start your trading day. Read it now by starting a two-week free trial to Bespoke Premium. CLICK HERE to learn more and start your free trial.
“Full of sound and fury, signifying nothing.” – Macbeth
In the markets and life in general, the most hyped events almost always fail to live up to expectations, and while last night’s debate was eagerly anticipated, it was a big disappointment that devolved into shouting and name-calling devoid of any substance. The seven words from Macbeth summed it up best.
In other news this morning, ADP Employment topped expectations by 100K (749K vs 649K), and the Chicago PMI was so strong that they released it early (62.4 vs 52.0 expected). The second revision to Q2 GDP also came in slightly less disastrous than expected (-31.4% vs -31.7%).
The initial reaction to last night’s debates in the betting markets was clearly in Biden’s favor. Over at electionbettingodds.com, the odds for Biden to win the November election jumped back nearly to new highs after rising 4.9 percentage points in the last day to just under 60%. Trump’s odds, conversely, dropped more than four points to below 40%.
