Chart of the Day – COVID Stocks Play Catch Up
Not All Bad for the Empire Fed
The New York Fed kicked off the slate of December manufacturing data this morning with the release of the Empire State Manufacturing Survey. The release was expected to come in at the same level as last month (6.3), but instead, moved lower down to 4.9. The index remained positive meaning the survey’s results were again consistent with growth, just at a slightly lower rate than expected. Even though current conditions have not been improving rapidly, respondents generally remain optimistic for the future. The index for expectations six months out was slightly higher at 36.3. While higher, it is off the highs from just a few months ago still at more optimistic levels than were observed over the last couple of years.

Even though the headline index fell 1.4 points this month, breadth in the report was fairly strong. Most indices were higher relative to November with the only two indices declining being those of New Orders and Prices Received. Meanwhile, only two indices—those for Unfilled Orders and Inventories—showed contractionary readings in December which is no different from last month. Granted, both of these indices also showed less of a contractionary picture. Expectations readings for the same indices, on the other hand, were more mixed with around half lower month over month.

One of the two indices to decline in December was New Orders. The decline was small though as the index dropped just 0.3 points to 3.4. Outside of August’s contractionary reading, that is the lowest reading for New Orders in the past six months. Granted, the positive reading meant new orders have now risen for four straight months, albeit at a slower pace in November and December.
As New Orders continue to grow, Unfilled Orders are getting worked off. The index for Unfilled Orders has remained in contraction for every month since April now. This month’s reading of -3.6 was the second-highest reading of that period behind July’s reading of -0.6. The expectations index, though, remains much more optimistic. 25.7% of respondents reported that they expect unfilled orders to be higher in six months compared to 11.4% reporting they expect orders to be lower. That resulted in the index rising to 14.3, the highest since February of 2018. The 9.7 point increase was also the largest one month move in expectations since November of last year.

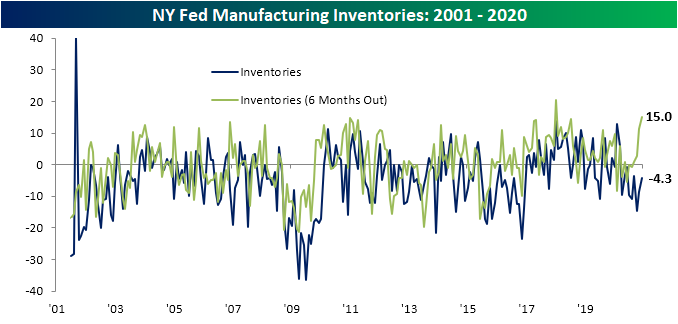
With businesses meeting demand, inventories have continued to decline. The index for Inventories has now been in contraction for nine consecutive months. Granted, this month saw the index move higher from -8.6 to -4.3. That means inventories have continued to decline but at a slower pace in December. Similar to unfilled orders, there is also quite a gap between current conditions and expectations. The index for future expectations rose to a reading of 15 in December. That is the second-highest reading on record behind January of 2018’s high of 20.3. In other words, even though inventories have declined for nine straight months, firms are not anticipating that to continue. Nearly 30% of responding firms reported that they expect inventories to rise in six months’ time.
While there were more improvements in demand and inventories were lower, prices for inputs have been on the rise. The index for Prices Paid rose 8 points to 37.1 in December. Expectations for Prices Paid likewise moved higher reaching the highest level in two years. Prices Received are not experiencing the same degree of upward pressure though. The index for Prices Received fell in December from 11.3 to 10 which is a much more modest reading overall. That is not to say it will continue to be that way. Expectations for Prices Received rose to a reading of 30, the highest level since February of 2018.

In spite of the rise in COVID cases, the report’s readings on employment were pretty strong. The index for the Number of Employees rose to 14.2 which was a two-year high while the index for the Average Workweek was unchanged at 4.8. So New York area manufacturers are not only hiring at their fastest rate since the end of 2018, but they are also increasing working hours. Click here to view Bespoke’s premium membership options for our best research available..

Bespoke Stock Scores — 12/15/20
Energy Stocks Breaking Out or Down?
While every other sector is down over the past week, the Energy sector is unchanged as it sits further above its 50-DMA than any other sector as shown in the screenshot of our Trend Analyzer below. Of all the sector ETFs, the Energy sector (XLE) is 17.87% above its 50-DMA compared to the other sectors which are an average of just 2.64% above their 50-DMAs. While lower in its trading range relative to the last week, it is also one of the most overbought sectors.
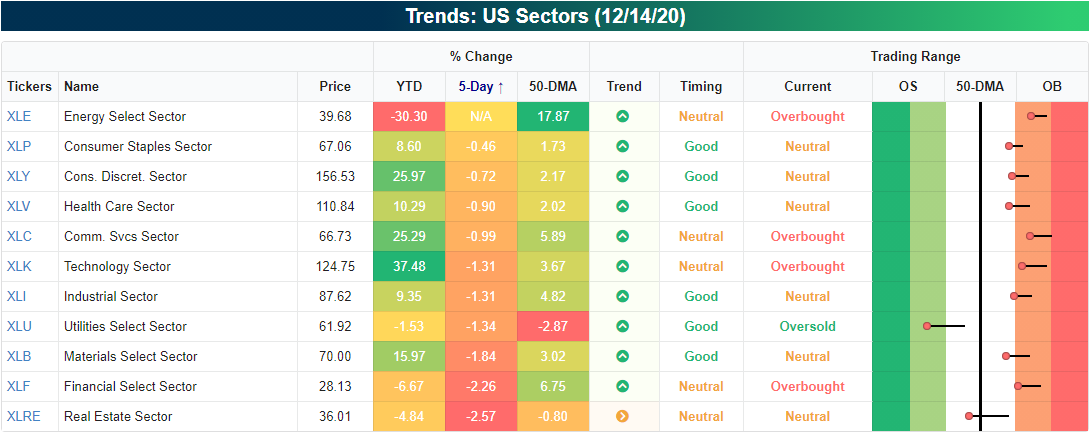
Looking at the chart of XLE, the recent leg higher puts it smack dab in the middle of the range between the spike to the post-pandemic high in June and the high end of the range that had been in place for most of the spring and summer.

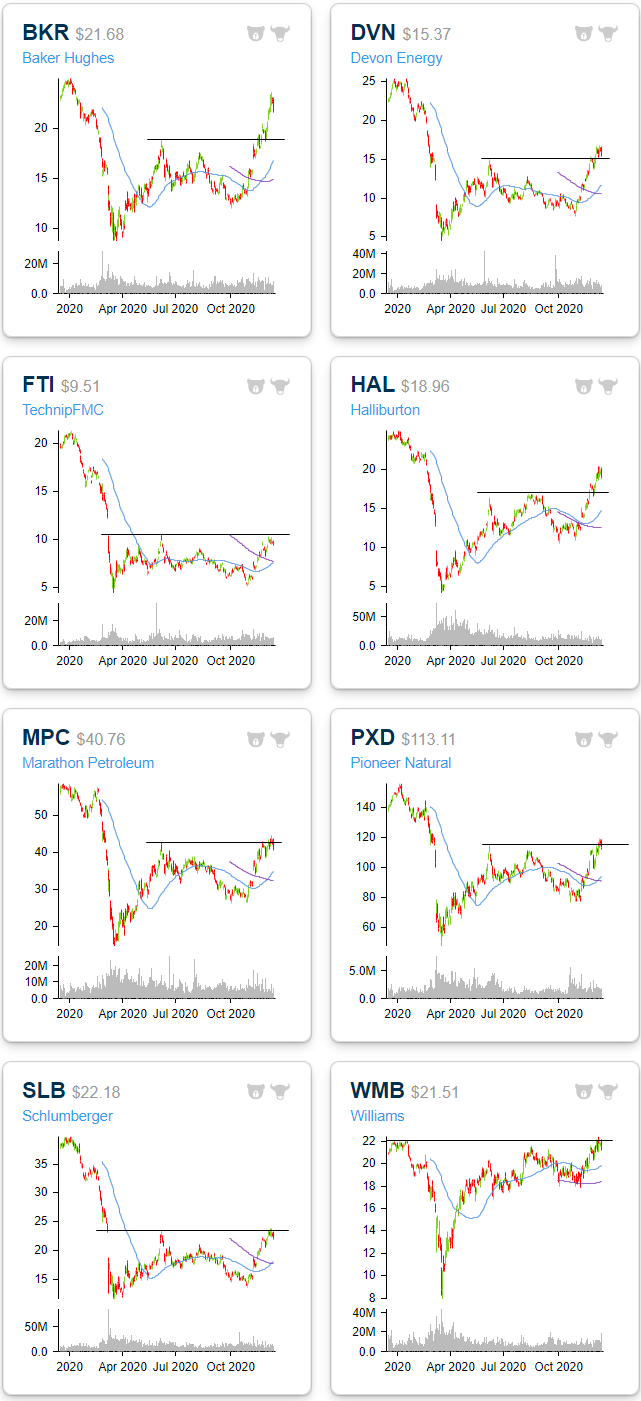
Across many individual stocks in the sector, it is the same picture. As shown in the snapshot of Energy sector stocks from our Chart Scanner tool below, a number of individual stocks are below their late spring highs but are also above more consistent highs from the spring and summer.

That is not the case for all stocks in the sector though. Some have in fact moved above those spring spikes. For example, Baker Hughes (BKR) and Haliburton (HAL) have moved well above those highs. Meanwhile, others like Marathon Petroleum (MPC), TechnipFMC (FTI), and Schlumberger (SLB) have been trading right around those highs, yet to make a significant break in any direction.
As previously mentioned, Energy has actually seen decent performance recently. As a result, 96% of the sector’s stocks currently trade above their 50-DMAs meaning there are only two stocks trading below: Cabot Oil and Gas (COG) and Noble Energy (NBL). That compares to a reading of 75% for the broader S&P 500, and only Communication Services has a stronger reading at 100%. Click here to view Bespoke’s premium membership options for our best research available.


Bespoke’s Morning Lineup – 12/15/20 – Futures Giving it Another Go
See what’s driving market performance around the world in today’s Morning Lineup. Bespoke’s Morning Lineup is the best way to start your trading day. Read it now by starting a two-week free trial to Bespoke Premium. CLICK HERE to learn more and start your free trial.
“What the wise do in the beginning, fools do in the end.” – Warren Buffett
After four days in a row of losses, equities are looking to break the streak today. The FOMC begins a two-day policy meeting today, so any news on that front won’t be out until tomorrow. In economic data this morning, Import Prices missed expectations (0.1% vs 0.3%) while export prices were higher than expected (0.6% vs 0.2%). The Empire Manufacturing report for December came in slightly weaker than expected (4.9 vs 5.4), but considering the rising caseloads and concerns over their economic impact, it’s encouraging to see that this reading is still positive at least.
Be sure to check out today’s Morning Lineup for updates on the latest market news and events, a recap of economic data out of China, an update on the latest national and international COVID trends, and much more.

What a year it has been for the US Dollar. At the height of the pandemic, flows into the dollar surged as investors sought safety in the uncertainty. At its peak in March, the US Dollar Index surged to its highest level in over three years (January 2017). As concerns over the pandemic eased, though, all of those inflows quickly unwound, and now less than nine months later, the Dollar Index is trading at its lowest level in more than two years (April 2018).

While pot stocks or emerging market currencies have no problem with swinging wildly from multi-year highs to multi-year lows in a matter of months, for an asset like the US Dollar, moves of this magnitude are much less common. The chart below shows the number of days in each year that the US Dollar Index has closed at a two-year high (blue bars) or a two-year low (red bars). Going back to 1973, a period spanning nearly half a century, there have only been three other years where the Dollar Index has closed at two-year highs and two-year lows in the same year. Those years were 1985, 1994, and 2008.

Daily Sector Snapshot — 12/14/20
B.I.G. Tips – Holidays At Home
B.I.G. Tips – Surging SPACs
Chart of the Day – CAT Sales Clawing Back
Bespoke’s Morning Lineup – 12/14/20 – Vaccine Day
See what’s driving market performance around the world in today’s Morning Lineup. Bespoke’s Morning Lineup is the best way to start your trading day. Read it now by starting a two-week free trial to Bespoke Premium. CLICK HERE to learn more and start your free trial.
“Spend each day trying to be a little wiser than you were when you woke up.” – Charlie Munger
If you were wondering how many times the market can rally on the same news, the answer is at least one more time. Once again today, the market is rallying on news related to the COVID vaccine, which has started shipping in the US and will start going in the arms of Americans around the country this week. It’s a quiet day with no economic news on the calendar, but as has been the case every day lately, we’re also likely to see a number of headlines related to the prospects (or lack thereof) for an additional relief bill.
Be sure to check out today’s Morning Lineup for updates on the latest market news and events, a recap of the Japanese Tankan survey, an update on the latest national and international COVID trends, and much more.
With a gain of just over 1%, the S&P 500 is already having a decent month, but if seasonal trends are any indication, the second half should be even better. The chart below comes from our Seasonality Tool and shows the median historical one week, one-month, and three-month performance of the S&P 500 over the last ten years. In terms of the one-week and one-month performance, the median gains of 1.2% and 2.93%, respectively, both rank above the 90th percentile. Looking further out over the next three months, the S&P 500’s median gain of 4.06% is still impressive but doesn’t rank quite as strong in the 79th percentile.
