Bespoke’s Morning Lineup – 12/24/20 – Quiet Day Ahead of Christmas
See what’s driving market performance around the world in today’s Morning Lineup. Bespoke’s Morning Lineup is the best way to start your trading day. Read it now by starting a two-week free trial to Bespoke Premium. CLICK HERE to learn more and start your free trial.
“‘Twas the night before Christmas, when all through the house, not a creature was stirring, not even a mouse.”
It’s very quiet on Wall Street this morning as there’s little in the way of news or events to speak of. That’s the way it should be for Christmas Eve, though. Today’s session for equities is an abbreviated one with the market closing for the week at 1 PM. If you celebrate the holiday, have a great Christmas. If not, enjoy the three-day weekend anyway!
Be sure to check out today’s Morning Lineup for updates on the latest market news and events, the latest on Brexit, an update on the latest national and international COVID trends, and much more.

Small-cap investors have gotten an early Christmas present this year as just this week, the Russell 2000’s rally off its closing low in March topped 100%. In the history of the Russell 2000, there has only been one other time where the index rallied more than 100% from a low within a year or less and only one other time where the rally topped 90%. The biggest rally within a year of a closing low was in the period ending June 1983 while the 90%+ rally was in the period ending in March 2010 coming out of the financial crisis.

Daily Sector Snapshot — 12/23/20
2021 Outlook — International Markets
Our 2021 Bespoke Report market outlook is the most important piece of research that Bespoke publishes each year. We’ve been publishing our annual outlook piece since the formation of Bespoke in 2007, and it gets better every year! In this year’s edition, we’ll be covering every important topic you can think of that will impact financial markets in 2021.
The 2021 Bespoke Report contains sections like Valuation, The Fed, Sector Technicals and Weightings, COVID, Dollar & Stocks, Yield Curve & Fed, Commodities, and more. We’ll also be publishing a list of our favorite stocks and asset classes for 2021 and beyond.
We’ll be releasing individual sections of the report to subscribers until the full publication is completed by year-end. Today we have published the “International Markets” section of the 2021 Bespoke Report, which looks at the performance, fundamentals, market caps, and more of stock markets around the globe. We also review the current and 2021 forecasted interest rate and broader economic environments for several of the world’s largest economies.
To view this section immediately and all other sections, become a member with our 2021 Annual Outlook Special!

Claims Well Below Expectations
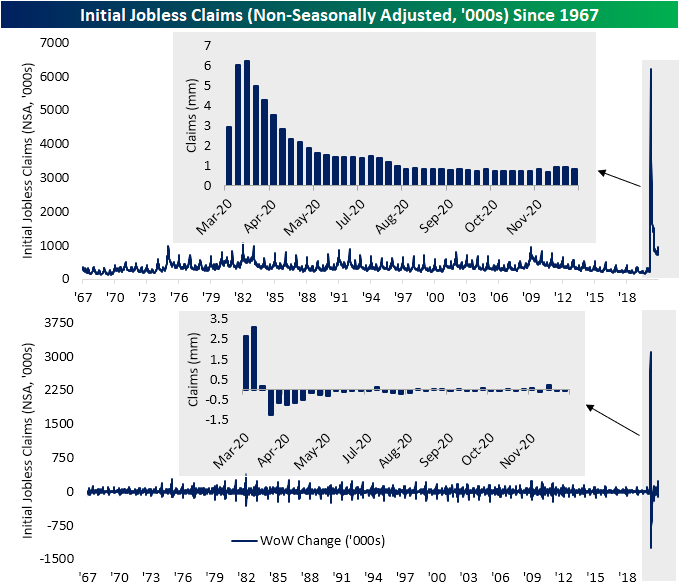
Over the past few weeks, initial jobless claims have been fairly elevated in the 800K range and moving higher. Last week’s reading came in at the highest level since the first week of September and was revised even higher this week to 892K (compared to 885K originally). While claims remain elevated, they improved in a big way this week. Claims were expected to drop to 880K, but instead, claims saw their largest one-week decline since the last week of August, falling to 803K.

As we noted last week, on an unadjusted basis claims were lower thanks likely to seasonal effects. The current week of the year’s seasonal effect was not quite as strong, but it marked another decline in the non-seasonally adjusted number nonetheless. Unadjusted claims came in at 869.4K from 941.9K last week. Again, although this was an improvement, claims are still coming in at some of the highest levels of the past few months.
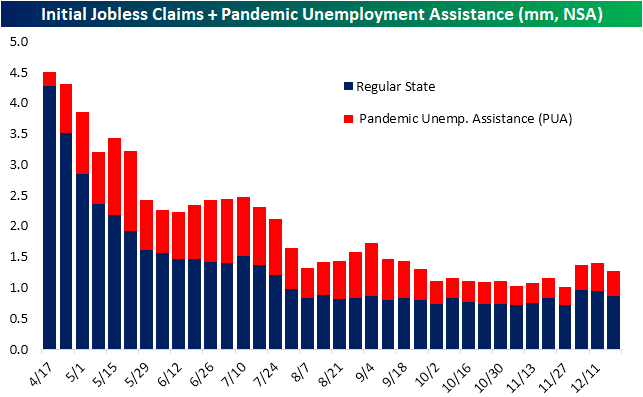
Including other programs, it is the same story. Regular state claims in combination with Pandemic Unemployment Assistance (PUA) claims were lower dropping to 1.267 million from 1.396 million. While lower, outside of the prior two weeks, that is still the highest level since the last week of September. The decline this week was broad with both regular state claims and PUA claims falling sequentially.
Continuing claims are lagged an additional week to initial claims meaning the most recent reading is for the week of December 11th; the same week as initial claims recent high of 892K. In spite of that week’s big inflow into the unemployment insurance system, continuing claims actually fell 170K to a pandemic low of 5.337 million.

As we have frequently made note of recently, the continuing claims number does not tell the full story though. Including all programs adds another week’s lag but gives a more complete picture. Total continuing claims across all programs for the week of December 4th totaled 20.4 million. While that was lower sequentially, it was also above the pandemic low of 19 million from the week of November 20th. Breaking this number down by program, while regular state claims are around their lows of the pandemic, PUA claims have risen for two straight weeks and are back up to where they stood in October. Meanwhile, extension programs remain elevated. Pandemic Emergency Unemployment Compensation (PEUC) did fall week over week, although at those levels, the reading was above all but one other week since the pandemic started. Conversely, the Extended Benefits program saw an uptick to a new pandemic high of 712.9K. Click here to view Bespoke’s premium membership options for our best research available.

2021 Outlook — The Year in Headlines
Our 2021 Bespoke Report market outlook is the most important piece of research that Bespoke publishes each year. We’ve been publishing our annual outlook piece since the formation of Bespoke in 2007, and it gets better every year! In this year’s edition, we’ll be covering every important topic you can think of that will impact financial markets in 2021.
The 2021 Bespoke Report contains sections like Valuation, The Fed, Sector Technicals and Weightings, COVID, Dollar & Stocks, Yield Curve & Fed, Commodities, and more. We’ll also be publishing a list of our favorite stocks and asset classes for 2021 and beyond.
We’ll be releasing individual sections of the report to subscribers until the full publication is completed by year-end. Today we have published the “The Year in Headlines” section of the 2021 Bespoke Report, which takes a look back on some of the many major headlines to have come out this year plotted on the S&P 500.
To view this section immediately and all other sections, become a member with our 2021 Annual Outlook Special!
2021 Outlook — Analyst Ratings
Our 2021 Bespoke Report market outlook is the most important piece of research that Bespoke publishes each year. We’ve been publishing our annual outlook piece since the formation of Bespoke in 2007, and it gets better every year! In this year’s edition, we’ll be covering every important topic you can think of that will impact financial markets in 2021.
The 2021 Bespoke Report contains sections like Valuation, The Fed, Sector Technicals and Weightings, COVID, Dollar & Stocks, Yield Curve & Fed, Commodities, and more. We’ll also be publishing a list of our favorite stocks and asset classes for 2021 and beyond.
We’ll be releasing individual sections of the report to subscribers until the full publication is completed by year-end. Today we have published the “Analyst Ratings” section of the 2021 Bespoke Report, which looks at the current breakdown of Buy, Sell, and Hold ratings for S&P 500 stocks and sectors. We also look at how analyst ratings have changed throughout the year and how well the most and least loved stocks by analysts have performed.
To view this section immediately and all other sections, become a member with our 2021 Annual Outlook Special!
Housing Inventories Keep Dropping
Yesterday’s Existing Home Sales data from the National Association of Realtors for the month of November continued to impress. As discussed in last night’s Closer, Existing Sales came in at 6.69 million SAAR. Although lower, snapping a streak of five straight months of increases, sales continue to come in at some of the highest levels since 2006. With sales running at such a strong clip recently, inventory numbers have been nothing short of remarkable: there are only 1.32 million listed units nationally with 1.12 million single-family homes listed. Both respective readings are the lowest levels of the past two decades. Even with declines in volumes, the ongoing collapse in inventory levels has driven the number of units in inventory down to 2.37 months’ sales (only 2.25 months for single family homes), a new record low. We should note that implied new listings have indeed risen. They stand in the mid-6mm SAAR range, the highest since 2007 but still about 20% below the 8mm range that they hit in the mid-2000s. While prices are still extremely high, they did drop sequentially on the month thanks most likely to a shift in mix towards lower value homes. Click here to view Bespoke’s premium membership options for our best research available.

Bespoke’s Morning Lineup – 12/23/20 – Resting Up Ahead of the Holidays
See what’s driving market performance around the world in today’s Morning Lineup. Bespoke’s Morning Lineup is the best way to start your trading day. Read it now by starting a two-week free trial to Bespoke Premium. CLICK HERE to learn more and start your free trial.
“If you’re in a bad situation, don’t worry it’ll change. If you’re in a good situation, don’t worry it’ll change.” – John A. Simone Sr.
The President reminded markets last night that you should never count your chickens until they are hatched. After stimulus seemed like a done deal yesterday, the President’s Twitter announcement last night that unless COVID relief payments were increased from $600 to $2000 per American, he may not sign the bill. Whether this is just a bluff remains to be seen, but it definitely throws a wrench into the plans of lawmakers in DC, but more importantly, Americans who were just yesterday planning on receiving some relief.
It’s already been a busy morning of economic data. Durable Goods were mixed relative to expectations and Personal Income and Spending saw larger than expected declines. The one bright spot was employment as both Initial and Continuing Jobless Claims came in significantly better than expected.
Be sure to check out today’s Morning Lineup for updates on the latest market news and events, a discussion of President Trump’s veto threat, mortgage applications, an update on the latest national and international COVID trends, and much more.
Looking at some areas of the market these days, it seems as though the equity market does nothing but go up. While that may be the case in certain sectors, for the broader market we’ve essentially been experiencing a sideways consolidation for most of this month helping the S&P 500 work off overbought conditions.
The first example of this can be seen in the S&P 500’s 50-day moving average spread. While the S&P 500 traded at extreme overbought levels in mid-November, those extremes have been gradually worked off in the last month, and as of yesterday’s close, the S&P 500 was just barely at overbought levels.

For individual stocks, it’s a similar picture. Back on 11/16 when the S&P 500 reached its peak overbought reading, 73% of stocks in the S&P 500 were trading at overbought levels. In the month and a week since then, though, the legion of overbought stocks has been winnowed down to less than half of its recent peak level to yesterday’s reading of 32.4%. Markets can’t go straight up forever, but periods of consolidation like the ones we have seen in recent weeks are often just the rest markets needs after a sharp run higher.

Daily Sector Snapshot — 12/22/20
2021 Outlook – Thematic Performance
Our 2021 Bespoke Report market outlook is the most important piece of research that Bespoke publishes each year. We’ve been publishing our annual outlook piece since the formation of Bespoke in 2007, and it gets better every year! In this year’s edition, we’ll be covering every important topic you can think of that will impact financial markets in 2021.
The 2021 Bespoke Report contains sections like Valuation, The Fed, Sector Technicals and Weightings, COVID, Dollar & Stocks, Yield Curve & Fed, Commodities, and more. We’ll also be publishing a list of our favorite stocks and asset classes for 2021 and beyond.
We’ll be releasing individual sections of the report to subscribers until the full publication is completed by year-end. Today we have published the “Thematic Performance” section of the 2021 Bespoke Report, which discusses specific factor performance for US equity markets, including relative performance of small and large stocks, quantitative performance factors, and value versus growth. We review the long and short term performance of various factors. We finish up with a review of how various options strategies and hedge funds performed in 2020.
To view this section immediately and all other sections, become a member with our 2021 Annual Outlook Special!