The Bespoke 50 Top Growth Stocks — 10/22/20
Every Thursday, Bespoke publishes its “Bespoke 50” list of top growth stocks in the Russell 3,000. Our “Bespoke 50” portfolio is made up of the 50 stocks that fit a proprietary growth screen that we created a number of years ago. Since inception in early 2012, the “Bespoke 50” has beaten the S&P 500 by 170.6 percentage points. Through today, the “Bespoke 50” is at new all-time highs and up 319.5% since inception versus the S&P 500’s gain of 148.9%. Always remember, though, that past performance is no guarantee of future returns. To view our “Bespoke 50” list of top growth stocks, please start a two-week free trial to either Bespoke Premium or Bespoke Institutional.

Bespoke’s Morning Lineup – 10/22/20 – Reversing a Trend?
See what’s driving market performance around the world in today’s Morning Lineup. Bespoke’s Morning Lineup is the best way to start your trading day. Read it now by starting a two-week free trial to Bespoke Premium. CLICK HERE to learn more and start your free trial.
“It’s easy to come up with new ideas; the hard part is letting go of what worked for you two years ago, but will soon be out of date.” – Roger von Oech
The trend of the last few days has been one where the market traded with a positive bias in the morning only to give up those gains as the day went on. Overnight, we saw a setup where futures were lower and have been gradually working their way back to even. Could this be a signal of a reversal in the trend, or is this rally in the futures ahead of the opening bell just another pump fake to lure the bulls in? While the failure of the market to hang on to gains recently has been disheartening, as we noted yesterday, it isn’t a particularly uncommon pattern.
In economic news, initial and continuing jobless claims both came in better than expected. Initial claims dropped below 800K for the first time since March, and at 787K were nearly 100K below consensus forecasts of 870K. Continuing claims were just as positive. At 8.373 million, continuing claims were more than a million below consensus forecasts. Even with the positive numbers, though, there has been zero in the way of a positive reaction from the futures market.
Be sure to check out today’s Morning Lineup for a rundown of the latest stock-specific news of note, market performance in the US and Europe, key earnings data from the US and Europe, trends related to the COVID-19 outbreak, and much more.

While the S&P 500 is showing signs of what looks like a double-top, conditions in the corporate bond market haven’t shown any signs of stress. The chart below compares the S&P 500 to spreads on corporate bonds (using the BofA Corporate Master Index as a proxy) shown on an inverted basis. Through yesterday’s close, spreads on corporate bonds actually traded to their narrowest level since early March. Just as the corporate bond market hasn’t confirmed the recent upward moves in equities, they haven’t confirmed the weakness either. All this points to a market in consolidation mode and given an uncertain political and health outlook, can you blame the market for being indecisive?

Daily Sector Snapshot — 10/21/20
Chart of the Day: Scattered Investor Confidence
“Quitters”
Like an old pair of “quitters” that keep falling down because their elasticity is shot, the market has had its own trouble staying up over the last few trading days. Today isn’t over yet, but if the S&P 500 finishes around current levels it will mark the fourth straight day of finishing down at least half of one percent from its intraday high. Compared to the three days before, today’s pullback from an intraday high has actually been pretty mild up to this point. Following Monday’s 2%+ decline from the intraday high shortly after the open, yesterday, the S&P 500 traded down close to 1% from its afternoon high. These two reversals followed Friday’s late-day sell-off when the S&P 500 finished the day down 0.75% from its intraday high.

While it’s disheartening to see the market erasing early gains as the day goes on, it’s helpful to put the last four trading days into perspective. Over the last 25 years, it hasn’t been uncommon for the S&P 500 to finish the day down at least 0.5% from an intraday high for four days in a row. The current streak, if it holds, would be the 158th such streak of four or more days. That works out to more than six a year. There have also been a number of streaks that were much longer than the current one. In fact, it was only a month ago that the S&P 500 went 11 straight days of finishing the day down at least 0.5% from its intraday high, and besides that streak, there have been five other streaks that spanned ten or more trading days. Start a two-week free trial to Bespoke Premium for instant access to our premium research and interactive tools!

Off Season Roadtripping
A staple of the recreational vehicle industry, Winnebago (WGO) reported third-quarter results this morning with strong results as the company beat on both the top and bottom lines. EPS came in at $1.45 versus estimates of $0.93. Not only was this the highest reported quarterly EPS for the company in our Earnings Explorer database, but it was also the biggest beat relative to expectations on record. Additionally, the company reported record sales in the quarter at $737.8 million; handily above estimates of $722.9 million and up 39% YoY. Despite the strong results, like most other stocks so far this earnings season, today’s report has been met with selling as the stock is down over 9% as of this writing. As shown in the snapshot of our Earnings Explorer below, all of this is somewhat in line with what could be expected for WGO’s third-quarter results. Even as the stock has boasted the highest beat rate of any quarter in Q3, its stock has only risen in response to its report half of the time. Even though Q3 is typically weak, today’s decline is on pace to be the worst reaction to earnings for WGO since December 2015 and the tenth worst on record.


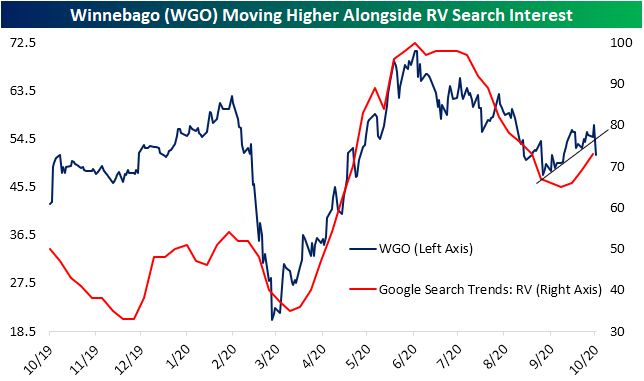
Back in the spring, interest (proxied by Google Trends data) in outdoor activities like camping, water activites, and recreational vehicles (RV) rocketed higher as people looked to get out of the house and do things that are COVID-safe. WGO was one of the major beneficiaries of these trends. As a result, WGO’s stock price had moved in tandem with search interest in RV’s, rapidly rising in the spring but fading through the summer. With the seasons’ change, search interest for things like boats and pools has waned. RV searches, however, have actually been on the rise again over the past few weeks with WGO’s price joining in. The two have continued to generally track one another well, although the decline in reaction to earnings today is turning this dynamic around.
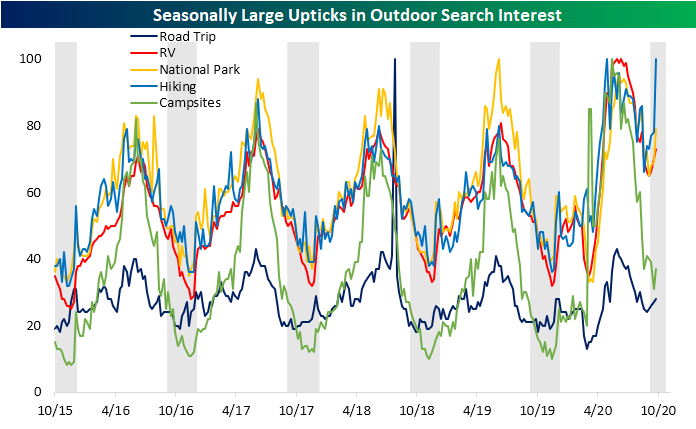
As we discussed in last week’s Bespoke Report, weaker interest in things like boats and pools are a no-brainer for the time of year and should eventually reach a seasonal trough. Turning back to RV interest in particular, over the past five years, search interest similarly has tended to fall from October through the end of the year (gray shaded regions in the chart below), with some sharp upticks at the very end of the year. This year is a bit different with a sizable uptick occurring early on in the final three months of the year. In the chart below we show Google Trend data for searches for RV’s as well as some other related terms like “Road Trip”, “National Park”, “Hiking”, and “Campsites”. These indices represent interest relative to the highest point of the respective term over the past five years. In other words, a reading of 100 is the peak whereas a reading of 50 is when interest was half of the peak.
So where are people taking these RV’s? Most likely the great outdoors, of course. National parks could certainly be one more specific possibility as search interest is similarly seeing an unusually large uptick given seasonality. To a lesser degree search interest for campsites and road trips are also experiencing unusual ticks higher for this time of year. The most impressive seasonally unusual upswing has been for hiking, which is right around some of the strongest levels of the past five years this week. In other words, COVID seems to be bringing a new fervor to leaf-peeping this fall. Just like we saw in the spring, that strength (this time around contrary to seasonal norms) would be positive for the businesses of names like WGO regardless of the sharp selling in response to earnings today.
Google Trends also provides a geographic breakdown by state of search trends which gives an even more in-depth look at this data. In the heat maps below, we show current search interest broken down on a state by state level. Search interest for these same terms are strongest in some areas of the country that are perhaps the least surprising: the Northwest (i.e. Montana and Wyoming) and Northern New England (Maine, Vermont, and New Hampshire). These are areas of the country that places like national parks or nature-oriented destinations are more prevalent especially in Autumn.

Chomping at the Bit for Bitcoin
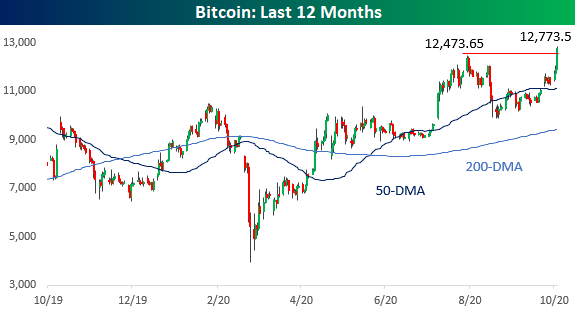
Paypal is making news this morning after the company said it will allow users to buy and sell cryptocurrencies in their accounts and use those funds to pay merchants. With increased/easier accessibility to bitcoin among Paypal customers, bitcoin is up over 7% this morning and trading at a new 52-week high.
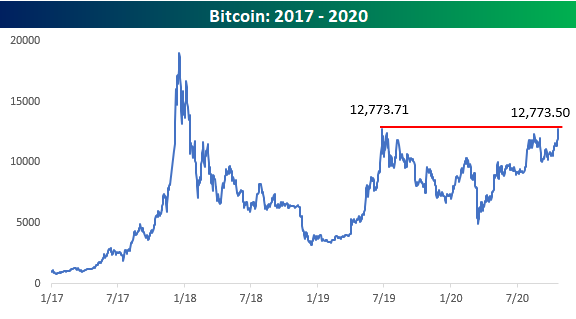
From a longer-term perspective, bitcoin isn’t just on the verge of a 52-week high. It’s also on the verge of taking out its summer high from 2019 forming a loose cup and handle pattern in the process. We would also note that the intraday high from mid-2019 is more than $1,000 higher at $13,851.60. To most people, the highs from late 2017 seemed like levels that wouldn’t be seen for years at the earliest, but if the 2019 highs are taken out, the conversation among crypto traders will inevitably shift focus back to those levels. Start a two-week free trial to Bespoke Premium for instant access to all of our research and interactive tools!
Bespoke’s Morning Lineup – 10/21/20 – It’s All About the Dollar
See what’s driving market performance around the world in today’s Morning Lineup. Bespoke’s Morning Lineup is the best way to start your trading day. Read it now by starting a two-week free trial to Bespoke Premium. CLICK HERE to learn more and start your free trial.
“If you want to know what God thinks of money, just look at the people he gave it to.” – Dorothy Parker
The earnings parade continued after the close and into this morning, and the results have generally been positive again. Once again, though, the positive news hasn’t provided a lift to markets. US equity futures are flat heading into the open after giving up modest gains overnight as uncertainty over any additional stimulus remains high.
Be sure to check out today’s Morning Lineup for a rundown of the latest stock-specific news of note, market performance in the US and Europe, key earnings data from the US and Europe, trends related to the COVID-19 outbreak, and much more.
Are there any two asset classes that have tracked each other as closely as the US Dollar and the S&P 500 over the last six months? The chart below compares the performance of the S&P 500 to the Bloomberg US Dollar Index over the last six months (shown in the chart on an inverted basis). In a pattern so reliable that it’s become nearly automatic, when the dollar rallies stocks decline and when the dollar declines stocks rally. Given the relationship between the two, equity bulls should be happy to see that the dollar is lower and not far from 52-week lows.

Daily Sector Snapshot — 10/20/20
The Software Sector’s Richest Stocks
There was a time not long ago when companies that traded at more than 20 times earnings were considered expensive. For investors in the software sector, valuing a stock based on its earnings multiple is considered a metric of a bygone era right up there with ticker-tape and trading floors. With most companies in the sector having no earnings to speak of, the more preferable way to value a company is to look at its multiple to revenues, but even by that metric, a number of companies trade at more than 20 times revenues.
The table below lists companies in the Russell 3000 Software industry that trade for more than 20 times annual sales. Of these 27 names, eight trade for more than forty times sales, and two – BigCommerce (BIGC) and Zoom Video (ZM) – trade at more than 100 times sales. With valuations like that, it’s hard to imagine what assumptions are being made about future growth. It’s not as though these companies are small either. Of the 27 stocks listed, more than two-thirds have market caps of more than $10 billion, and their combined market cap is over $750 billion. Regarding their valuations, you can say all you want, but investors have gotten rich owning them this year as their average YTD performance is a gain of 159.1%. The median is not as strong but is still an impressive 113.6%.

With a group of highflyers like this, you would think that this would be a good group to watch in terms of gauging the risk appetite of the broader market. To that end, the chart below compares an equally-weighted basket of the 27 stocks listed above to the S&P 500 over the last year. What’s interesting to note about their performance is that leading up to prior peaks in the last twelve months, the group peaked at the same time as the S&P 500. While the pricey software stocks provided no ‘advance warning’ of a market decline, following declines, it was helpful to watch. As shown by the three gray circles in the chart, during each of the notable market declines of the last year, investors started to rotate back into the group before the market made its ultimate low. Based on the last year, when these stocks start to take off, the rest of the market has followed suit.Start a two-week free trial to Bespoke Institutional to use our extremely useful Earnings Explorer tool today!
