Bespoke’s Morning Lineup – 10/29/20 – GDP Beats and Post Pandemic Low in Claims
See what’s driving market performance around the world in today’s Morning Lineup. Bespoke’s Morning Lineup is the best way to start your trading day. Read it now by starting a two-week free trial to Bespoke Premium. CLICK HERE to learn more and start your free trial.
“It’s not what happens to you, but how you react to it that matters.” – Epictetus
We got some big economic numbers this morning as Q3 GDP rose at an annualized rate of 33.1% versus forecasts for growth of 32.0. This is obviously a record number, but when a 33.1% gain follows a 31.4% drop, you’re still almost 10% in the hole. Jobless claims also dropped this week as both initial and continuing claims dropped to post-pandemic lows. So far, the initial market reaction has been positive. Futures were higher overnight, reversed all of those gains and more heading into the report, but have now moved back into positive territory after the releases.
Be sure to check out today’s Morning Lineup for a rundown of the latest stock-specific news of note, market performance in the US and Europe, key earnings data from the US and Europe, economic data, trends related to the COVID-19 outbreak, and much more.

Even for a big down day like yesterday, there was a pretty decent amount of technical damage within the market as the percentage of stocks trading above their 50-day moving average (DMA) dropped from 46.1% down to 27.4%. Heading into this week, more than two-thirds of stocks in the S&P 500 were above their 50-DMA, today it’s less than a third, and based on where the futures are now, it may be less than a quarter by the closing bell.
The last time there was a lower percentage of stocks above their 50-DMA was just back at the September lows when it bottomed out at 25.5%, and before that, you have to go back to the Spring to find lower readings. All in all, readings like the current one represent oversold conditions but aren’t especially rare.

B.I.G. Tips – A Really Lousy Day
Daily Sector Snapshot — 10/28/20
All or Nothing Days Back on the Rise
The S&P 500’s A/D line for the day (number of advancing stocks minus number of declining stocks) currently stands at about -460, which would be the weakest one-day reading since June. Today’s A/D reading also is notable in that it represents the tenth ‘all or nothing’ day for the S&P 500 since the index’s last peak on 9/2. We consider ‘all or nothing’ days to be those days where the S&P 500’s daily A/D reading is either above +400 or below -400. To put the frequency of ‘all or nothing’ days into perspective, while there have been ten in the last forty trading days, in the forty trading days before that there weren’t any.
The chart below shows the percentage of ‘all or nothing’ days on a 50-day rolling basis. The current pace of 20% is still well off the extraordinary level of 44% we saw back in late April/early May, but it is still relatively high.

Including today, there have now been 41 ‘all or nothing’ days so far in 2020. If the current pace for the entire year keeps up that will put us on pace for fifty days this year. If the current pace keeps up and we do reach 50 ‘all or nothing’ days this year, it will be the third-highest annual total behind 2011 (70) and 2008 (52), but even if there isn’t another ‘all or nothing’ day this year, 2020 would still rank fifth behind the years from 2008 through 2011. Like what you see? Click here for instant access to our research and interactive tools.

Earnings and Economics Diverge
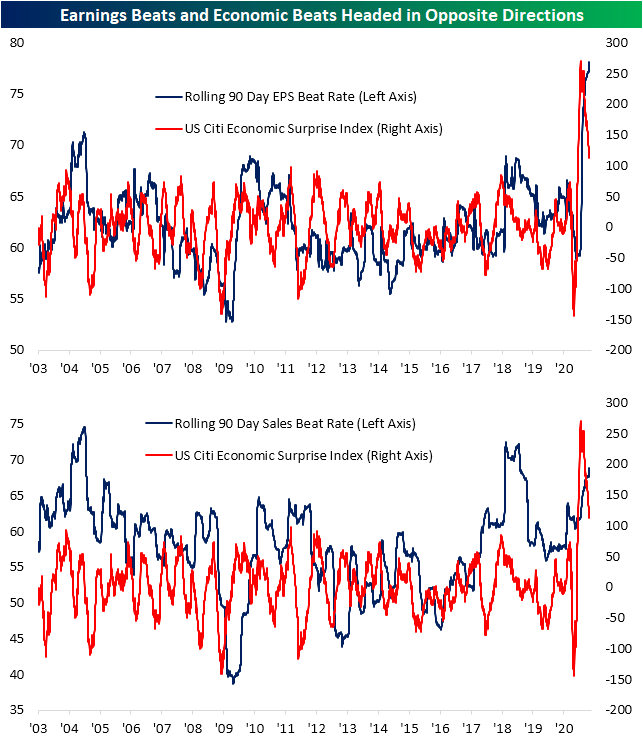
This earnings season, we have frequently mentioned how beat rates have continued to rise relentlessly. From our Earnings Explorer database, our 3-month rolling EPS beat rate currently stands at a record high of 78.19%. That is nearly 20 percentage points higher than the historical average of 59.37%. The sales beat rate is not at a record, but it too is elevated at 69.09% versus the historical average of 56.45%. That means that of the companies that have reported earnings over the past three months, a massive proportion are exceeding consensus sales and EPS estimates.
While earnings beat rates have continued to grind higher, economic data is another story. The Citi Economic Surprise Index basically tracks macroeconomic data and how it comes in relative to forecasts. Higher readings indicate the data is trending stronger than expected and vice versa for negative readings. With the unprecedented shock to macroeconomic data in 2020, this index for the United States plummeted, but that was followed by a sharp rebound to record highs. Although the index for the US remains higher than anything prior to the pandemic, it has been heading lower since the summer. In other words, economic data is still coming in better than expected but is not massively exceeding expectations to the degree it was back in the spring and early summer.
The two charts below compare EPS and revenue beat rates to the Citi Economic Surprise Index. Comparing the two series to the Citi Economic Surprise Index shows that while EPS beat rate has been somewhat connected (correlation: +0.325)) there is very little in the way of correlation between the Surprise Index and the revenue beat rate (+0.084). Given that EPS figures are typically easier to massage than revenues, that was a bit of a surprise. What is notable about the recent decline in the Citi Economic Surprise Index is that in prior periods where it became elevated and then pulled back as it did in (2003, 2009, and 2018), the EPS beat rate typically didn’t peak and start to trend lower for another few months. Click here to view Bespoke’s premium membership options for our best research available.
More Pain for European Stocks
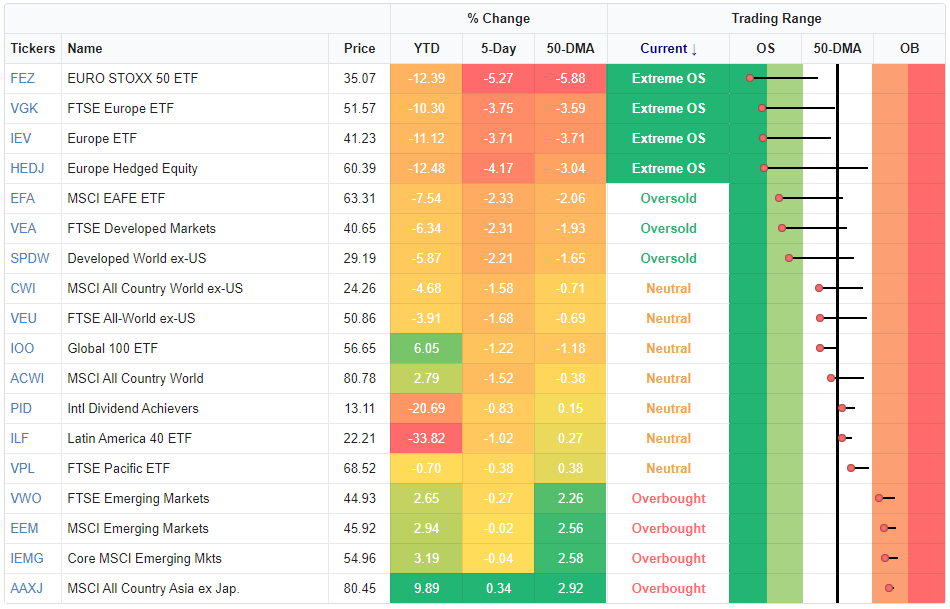
Looking across the various regions tracked in our Trend Analyzer tool, broadly speaking equities are lower over the past week, but some of the worst performance comes from across the pond in Europe. As shown, the ETFs tracking European equities are all down the most over the past five days through yesterday’s close. That leaves each one over 2 standard deviations below their 50-DMAs. On a year to date basis, these have similarly been serial underperformers along with the Latin America 40 ETF (ILF).
Taking a more granular look at specific European countries, in the charts below we show the ETFs tracking the equity markets of each of the European countries in our Global Macro Dashboard as well as an ETF tracking European equities more broadly: the iShares Europe ETF (IEV). As shown, whereas the region was already weak headed into today’s session, the pain has only gotten worse this morning. So far today, these 10 ETFs are down an average of around 4% as the region experiences an upswing in COVID cases and reinstating of lockdowns in places like Germany and France.
From a technical perspective, today’s big drops are not doing these country ETFs any favors. Most of these ETFs have been trading sideways over the past few months, and today’s sharp turn lower is marking breaks of various support levels. For some like Sweden (EWD), it is a break below the 50-DMA while others like Germany (EWG) are falling below their longer term 200-DMAs. Other country ETFs such as Spain (EWP) and Russia (ERUS) have been trading under their moving averages for some time now, but today’s decline has broken additional support that was formed from prior lows. Click here to view Bespoke’s premium membership options for our best research available.
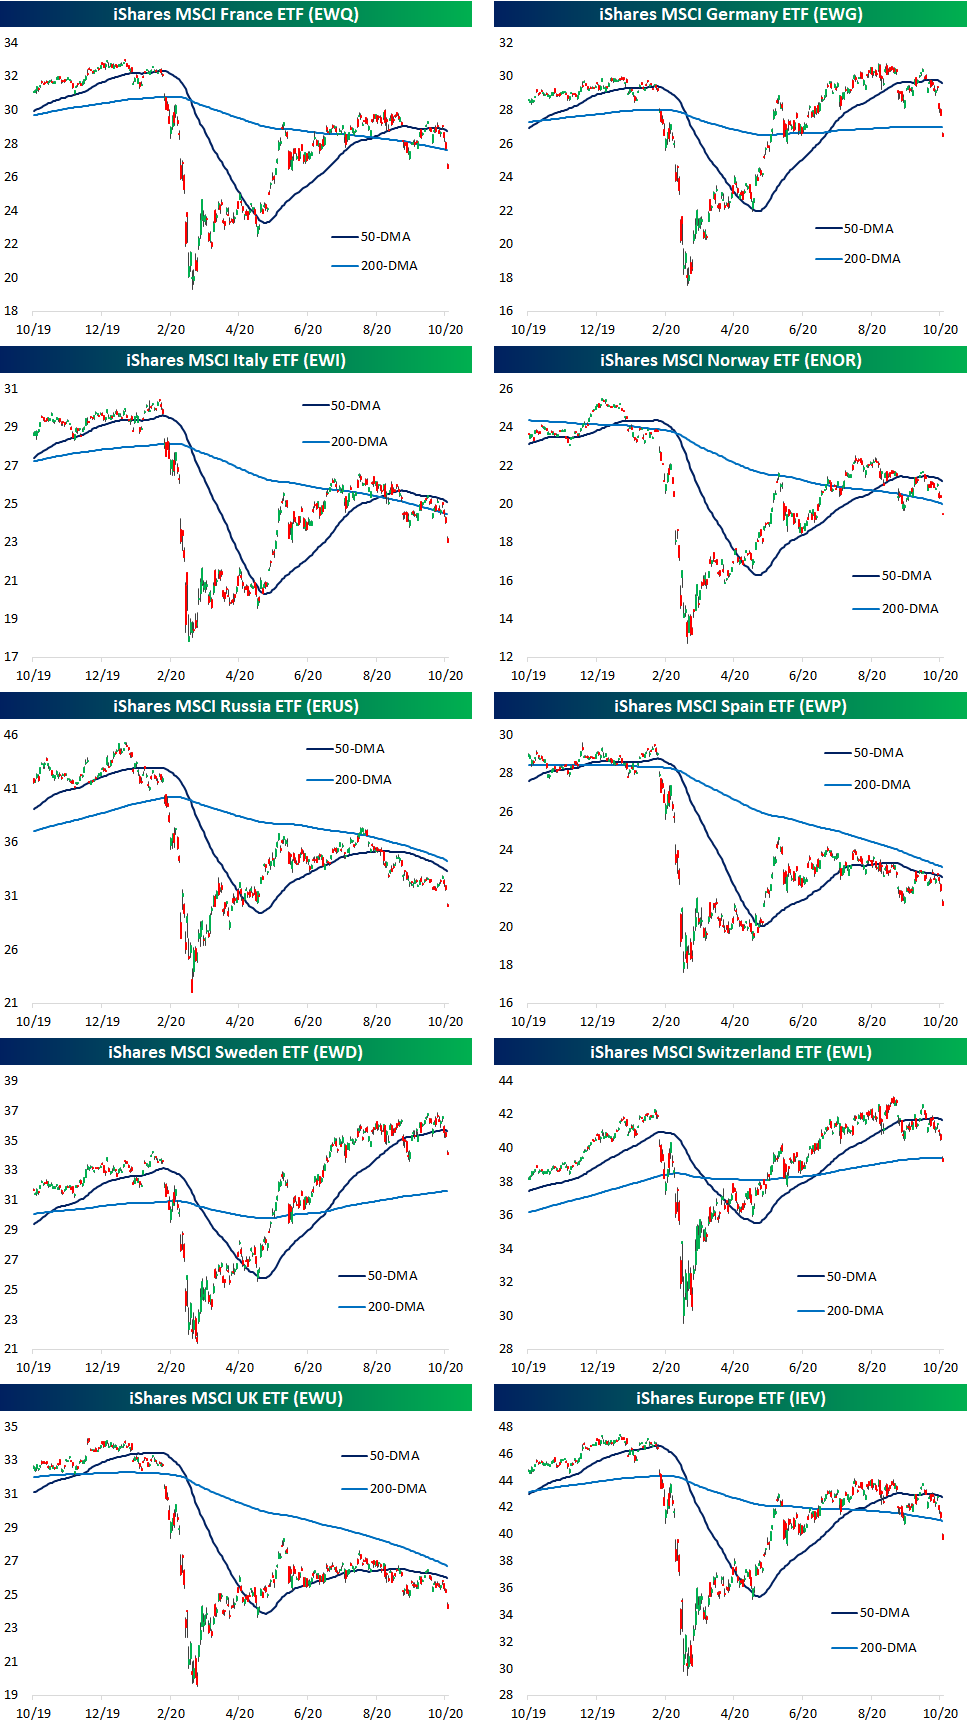
Chart of the Day: Stocks for the COVID Economy Back in Play
Industrials Malfunction
With poorly received earnings reports from 3M (MMM) and Caterpillar (CAT) and general weakness overall, Tuesday was just a bad day for the Industrials sector. Just five stocks in the sector were up on the day and the sector overall was down 2.2% compared to the S&P 500 which was down just 0.3%.

The chart below shows the daily performance spread between the S&P 500 and the Industrials sector over the last year. Positive readings indicate the S&P 500 outperforming the Industrials sector and negative readings indicate that the Industrials sector outperformed the S&P 500. With the S&P 500 outperforming the Industrials sector by 1.88 percentage points on Tuesday, it was the widest performance gap (in the S&P 500’s favor) since 9/21. Even more notable, though, was the fact that there have only been three other days in the last year where the Industrials sector underperformed the S&P 500 by a wider margin.
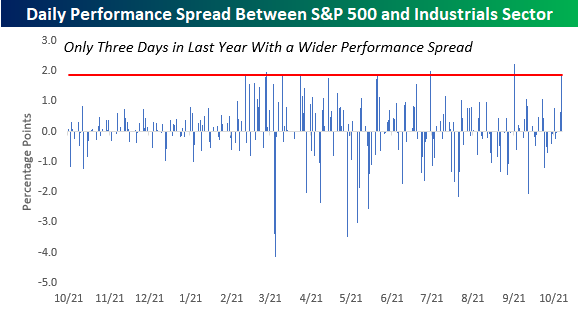
For the sector as a whole, it currently finds itself in a precarious position. After breaking its uptrend off the March lows on 9/21, the Industrials sector bounced back and rallied back to its former uptrend line, and while it just recently made a post-COVID high, the rally ran out of steam right at the former uptrend line. In the pullback that has followed, the sector closed yesterday right at a secondary line of support from the June lows. If this level doesn’t hold through today’s close, the technical picture for the sector will look a lot different than the way it looked just a few weeks ago. Click here for instant access to all of our research and interactive tools.

Bespoke’s Morning Lineup – 10/28/20 – Tell Me Something I Don’t Know
See what’s driving market performance around the world in today’s Morning Lineup. Bespoke’s Morning Lineup is the best way to start your trading day. Read it now by starting a two-week free trial to Bespoke Premium. CLICK HERE to learn more and start your free trial.
“I believe in analysis and not forecasting.” – Nicolas Darvas
We’ve seen another strong night and morning of earnings reports with the vast majority of companies reporting better than expected earnings and revenues. Not only that, but a large number of companies have also raised guidance. By our count, we’ve already seen at least 13 earnings triple plays. That’s impressive! So what is the market’s reaction? Who cares? Tell me something I don’t already know.
Heading into this earnings season, analyst sentiment was very positive in terms of positive versus negative earnings revisions, and as we noted in our earnings season preview, that kind of positive sentiment often sets the expectations bar high for the following earnings season making it hard for companies to get over.
Besides earnings, concerns over COVID and the upcoming election are also weighing on investor sentiment. For many investors, the sentiment seems to be that given the uncertainty and range of possible outcomes, they would rather wait a week then make predictions as to the potential outcome.
Be sure to check out today’s Morning Lineup for a rundown of the latest stock-specific news of note, market performance in the US and Europe, key earnings data from the US and Europe, trends related to the COVID-19 outbreak, and much more.
With hopes of a stimulus deal before the election officially off the table, the hope for many has been that a Biden win next week coupled with a Democratic takeover of the Senate would yield a large stimulus. That’s been the hope at least. Based on recent trends in prediction markets, a blue sweep next week isn’t looking like as much as a sure thing. Without even getting into the Presidential race (where Biden still has a comfortable lead based on the betting markets and polls), the Senate is looking closer. According to PredictIt, the contract for Republicans keeping control of the Senate is up to 47, which is the highest level in over a month. Of all the possible scenarios for the election outcome next week, the one that would be least ‘stimulus friendly’ would be a Biden win coupled with a GOP Senate.
