Breadth Approving
With yet another positive vaccine-related headline pushing the market higher today, Industrials and Materials are both touching new 52 week highs. As for the other sectors, only Consumer Staples and Health Care alongside the broader S&P 500 have made new highs at some point in the month of November. At the moment, those same sectors as well as Tech, Consumer Discretionary, and Communication Services are all within 5 percentage points or less of their respective 52-week highs.
In terms of breadth, though, new highs have been easier to come by. As shown in the charts below, across the eleven sectors as well as the broader S&P 500, breadth has been generally confirming a move higher as only the cumulative A/D lines of Real Estate and Energy have not seen a new high within the past two weeks. Some of those new highs in breadth have also been a contrary story to price. With regards to Consumer Discretionary and Tech, prices have seen some lower highs over the past few months, but their advance-decline lines have been diverging from price and have continued to trend higher. Similarly, breadth in the Communication Services sector has continued to rip higher, unlike price which has stalled within the past couple of weeks.
Lastly, sectors making new highs in terms of price like Industrials and Materials have seen breadth do the same in recent days. Broadly speaking, the direction of breadth has been consistent with recent price moves, and even for the areas where that is not necessarily the case (as with Tech), the strong breadth can be taken as a positive for internals. Click here to view Bespoke’s premium membership options for our best research available.

Tesla (TSLA) Keeps Charging Ahead
It’s been a week now since the announcement was made that Tesla (TSLA) would be added to the S&P 500. What a week it has been! Since the close last Monday, TSLA has seen its market cap swell by more than $100 billion from $386.8 bln up to $492.9 bln. In a week! When the keepers of the S&P 500 made the announcement that TSLA would be added to the S&P 500, they noted that they were giving the investment community ample advance notice and would also seek the investment community’s feedback to determine the best way to handle it “due to the large size of the addition.” Well, it’s only been a week, but the complications of adding such a large component to the index have only gotten bigger over the last week. $106 billion bigger to be exact!
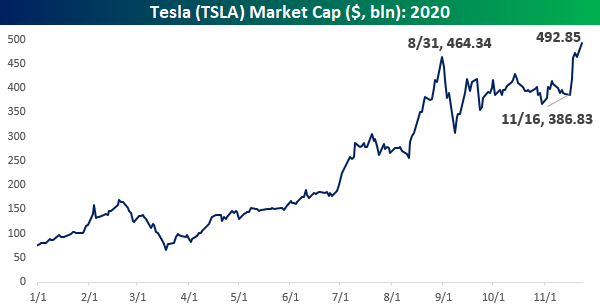
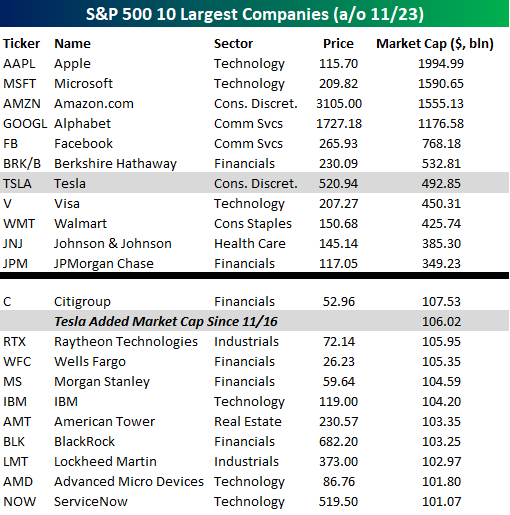
The table below lists the ten largest companies in the S&P 500 by market cap and where Tesla ranks among them. At a market cap of $492.85 billion, TSLA’s market cap ranks as the sixth-highest of any US company- over $40 billion more than Visa (V), and $40 billion below Berkshire Hathaway (BRK/B). While TSLA has the 6th largest market cap, it wouldn’t have the sixth-highest weighting, though. Because S&P 500 weightings are determined by the market caps of a company’s free-floating shares and not all of its shares are free-floating, TSLA’s weighting will be a few more notches down the list of the top ten companies.
Just as incredible about TSLA’s size going into the S&P 500, is the amount of market cap it has added since the announcement was made. With an increase in market cap of just over $106 billion in the last week, TSLA’s market cap has risen by almost as much as the entire market cap of Citigroup (C) and more than other large-cap stocks like Raytheon (RTX), Wells Fargo (WFC), Morgan Stanley (MS), and IBM. Click here to view Bespoke’s premium membership options for our best research available.
Bespoke’s Morning Lineup – 11/23/20 – More Positive Vaccine News
See what’s driving market performance around the world in today’s Morning Lineup. Bespoke’s Morning Lineup is the best way to start your trading day. Read it now by starting a two-week free trial to Bespoke Premium. CLICK HERE to learn more and start your free trial.
“You live and you learn. At any rate, you live.” – Douglas Adams
It looks like the market has another case of the Mondays. Unlike ‘typical’ Mondays, this Monday represents the third straight week that Americans are waking up to positive news related to vaccines. As one might expect given the headlines, futures are higher with reopening stocks leading the way. Stay at home stocks, on the other hand, are predictably trading lower. In both cases, though, the headlines seem to have a diminishing impact as the magnitude of the moves in all of these asset classes are smaller than the initial vaccine news from earlier this month on November 9th.
Be sure to check out today’s Morning Lineup for a rundown of the latest stock-specific news of note, Markit PMI data, trends related to the COVID-19 outbreak, and much more.

The CDC may be recommending that Americans stay at home rather than travel this Thanksgiving, but if recent air travel statistics are any indication, the advice isn’t necessarily being followed. The chart below shows the seven-day average y/y change in the number of passengers traveling through TSA checkpoints since the crisis began. On the one hand, passenger traffic is down an average of 61.2% relative to the same time last year. While that’s a big drop, it’s actually the least negative reading we have seen since March when the crisis began. Furthermore, yesterday’s passenger throughput was 1.048 million which was the highest single-day reading since March 16th and just the third day since then that there were more than 1,000,000 air passengers in a single day (Friday and 10/18 were the two others).

Bespoke Brunch Reads: 11/22/20
Welcome to Bespoke Brunch Reads — a linkfest of the favorite things we read over the past week. The links are mostly market related, but there are some other interesting subjects covered as well. We hope you enjoy the food for thought as a supplement to the research we provide you during the week.
While you’re here, join Bespoke Premium with a 30-day free trial!
mRNA
How to make a messenger RNA vaccine: inside the RNA manufacturing process (GreenLight Biosciences)
A quick read on how vaccines which rely on messenger RNA (mRNA) are manufactured. This is the core technology behind both Pfizer (PFE) and Moderna (MRNA) vaccines. [Link]
Why Moderna’s Vaccine Win Is a Giant Leap Against Pandemics by Max Nisen (Bloomberg)
New mRNA technology offers the promise for very rapid and scaled vaccine development as new pandemics emerge, and offers a series of key advantages over traditional vaccine manufacturing processes. [Link; soft paywall]
Immunity to the Coronavirus May Last Years, New Data Hint by Apoorva Mandavilli (NYT)
While there have been some isolated cases of reinfections, clinical data from blood samples of post-infection COVID patients suggests that the immune response to infection provides antibodies which are likely to last for years. [Link; soft paywall]
Social Media
Twitter rolls out Stories, aka ‘Fleets,’ to all users; will also test a Clubhouse rival by Sarah Perez (TechCrunch)
This week Twitter introduced a copycat feature that has been a part of Snapchat for years, and is considering a feature that works like audio-based social space Clubhouse. [Link]
Parler Makes Play for Conservatives Mad at Facebook, Twitter by Jeff Horwitz and Keach Hagey (WSJ)
A social media company supported by the financial backers of Breitbart News is making a play to draw disaffected conservatives from more traditional social media networks. [Link; paywall]
Thanksgiving
GasBuddy Study Finds 45% Fewer Travelers on the Road This Thanksgiving, Gas Prices Projected to Be Lowest Since 2016 (GasBuddy)
With the threat of the pandemic, many Americans are forgoing their traditional Thanksgiving gatherings, and that’s going to mean a lot less gasoline demand than normal. For those who do drive to see family, gas prices are set to come in much lower than historically normal. [Link]
38% of Americans planning a big Thanksgiving despite COVID-19: survey by Jesse O’Neil (NYP)
While there are major risks to large group gatherings amidst a global pandemic, COVID isn’t stopping about a third of the company from getting together for turkey this year. [Link]
Pressured Business Models
A Covid Baby Bust Is Bad News for These Businesses by Saabira Chaudhuri (WSJ)
The coronavirus pandemic is driving birthrates down dramatically, putting fresh pressure on demand for products designed for babies. [Link; paywall]
Retail Chains Shed Stores, but It Isn’t Good for Business by Suzanne Kapner (WSJ)
With so many stores empty, retailers are shuttering locations en masse, and as a result may have a hard time capturing demand when consumers feel safe walking the aisles again. [Link; paywall]
Rent Seeking
New York’s 4-Year-Olds Are Mastering Zoom to Get Into Elite Kindergartens by Amanda L. Gordon and Janet Lorin (Bloomberg)
The traditional interview process for elite kindergartens in New York City (yes, seriously) has moved to online meetings. Best of luck to the parents that need to keep kids under 5 focused for a Zoom call. [Link; soft paywall]
The Weekly Planet: What Donald Trump Taught the Electric-Car Industry by Robinson Meyer (The Atlantic)
With the auto industry pursuing its inevitable transition away from fossil fuels, Big Car and Big Oil are no longer playing on the same team when it comes to lobbying in Washington DC. [Link; soft paywall]
Finding Homes
Seoul converts hotels into studios to ease housing crunch by Song Jung-a (FT)
The South Korean government is purchasing 114,000 units of hotels and offices which are standing mostly empty thanks to COVID, aiming to ease a housing crunch. [Link; paywall]
Semis
Steve Jobs’s last gambit: Apple’s M1 Chip (Om)
A technical walk-through and deep dive into the implications of Apple’s new M1 chip, which packs graphics, basic processing, RAM, and other aspects of system architecture into a single, extremely efficient package. [Link]
Read Bespoke’s most actionable market research by joining Bespoke Premium today! Get started here.
Have a great weekend!
B.I.G. Tips – Top Earnings Triple Plays
The Bespoke Report – Waiting is the Hardest Part
There’s the old saying that if at first you don’t succeed, try, try, and try again. After positive vaccine news from Pfizer (PFE) on November 9th helped to push the S&P 500 and the Nasdaq to new highs, the major averages couldn’t hang onto those gains. If it didn’t work the first time, though, maybe news this Monday that Moderna’s (MRNA) vaccine was even more effective would do the trick. Markets rallied again, but once again couldn’t hang on to the gains. Throughout this week, there were more positive vaccine headlines, but each booster shot was less effective. The result? While equities closed out the week right near all-time highs, they’ve essentially been rangebound for the last two weeks as well as the last two and a half months.
Since Pfizer’s positive vaccine news before the open on 11/9, the S&P 500 and Nasdaq have essentially been on a treadmill with a number of swings up and down, but really nothing to show for any of it. Investors just can’t seem to make up their minds at this point between placing more emphasis on the shorter-term concerns of rising COVID hospitalizations or the positive long-term impacts of viable vaccines. Decisions. Decisions. We discuss all the latest trends in the market and the economy in this week’s Bespoke Report.
This week’s Bespoke Report newsletter is now available for members.

To read the report and access everything else Bespoke’s research platform has to offer, start a two-week free trial to one of our three membership levels. You won’t be disappointed!

Daily Sector Snapshot — 11/20/20
Tracking The US COVID Surge As European Cases Peak
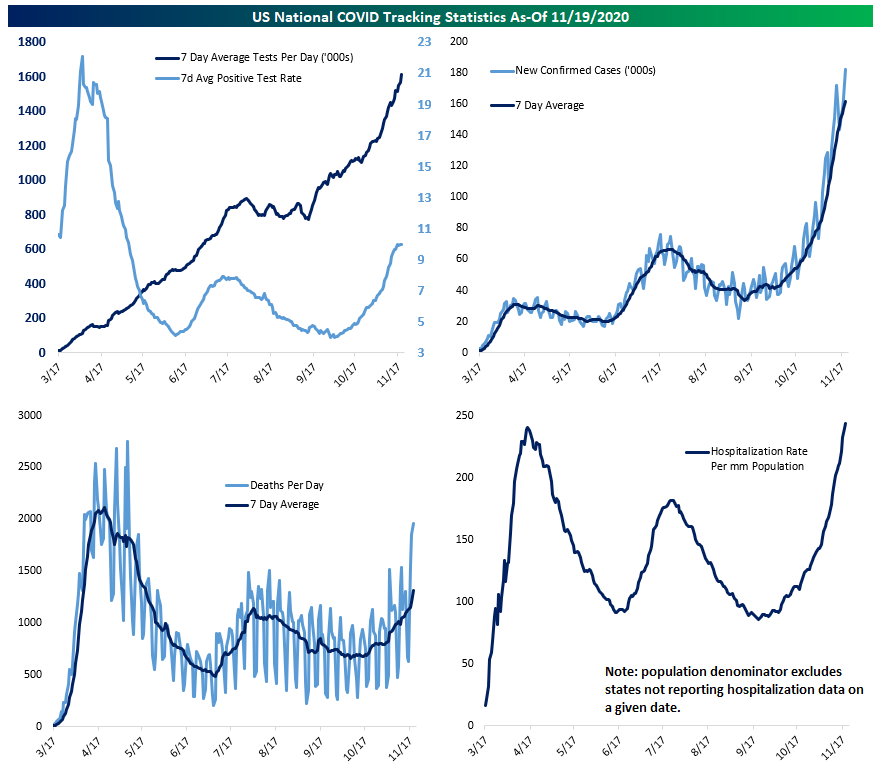
US COVID cases continue to rise sharply. Testing has also risen, but an increase to 10% positive test rates show that this is not simply about more testing. While there’s been a slow down in the percentage growth of confirmed positives that could be a leading indicator of a peak in daily new cases, Thursday’s numbers put a wrench in what had been a promising trend. A peak for daily new cases in the wake of Thanksgiving is still possible, but in the meantime millions of new cases will emerge. At a lag, hospitalizations will follow. Adjusted for the population of states reporting hospitalizations, hospitalization rates have reached new records. Like clockwork, deaths are following. Almost 2,000 Americans died yesterday, and at a lag to cases and then hospitalizations, the trend is accelerating. We update these charts and the analysis that goes with them every morning in our pre-market report The Morning Lineup. Click here to start a free trial to Bespoke Institutional and receive our daily Morning Lineup for the next two weeks, featuring more commentary and data on macro markets.
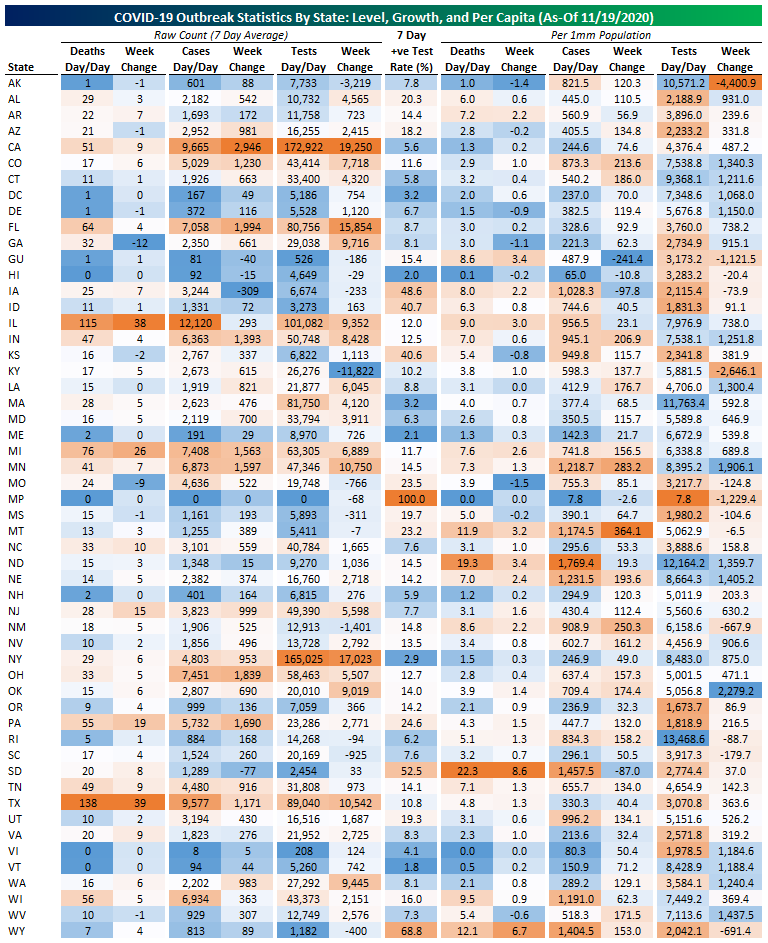
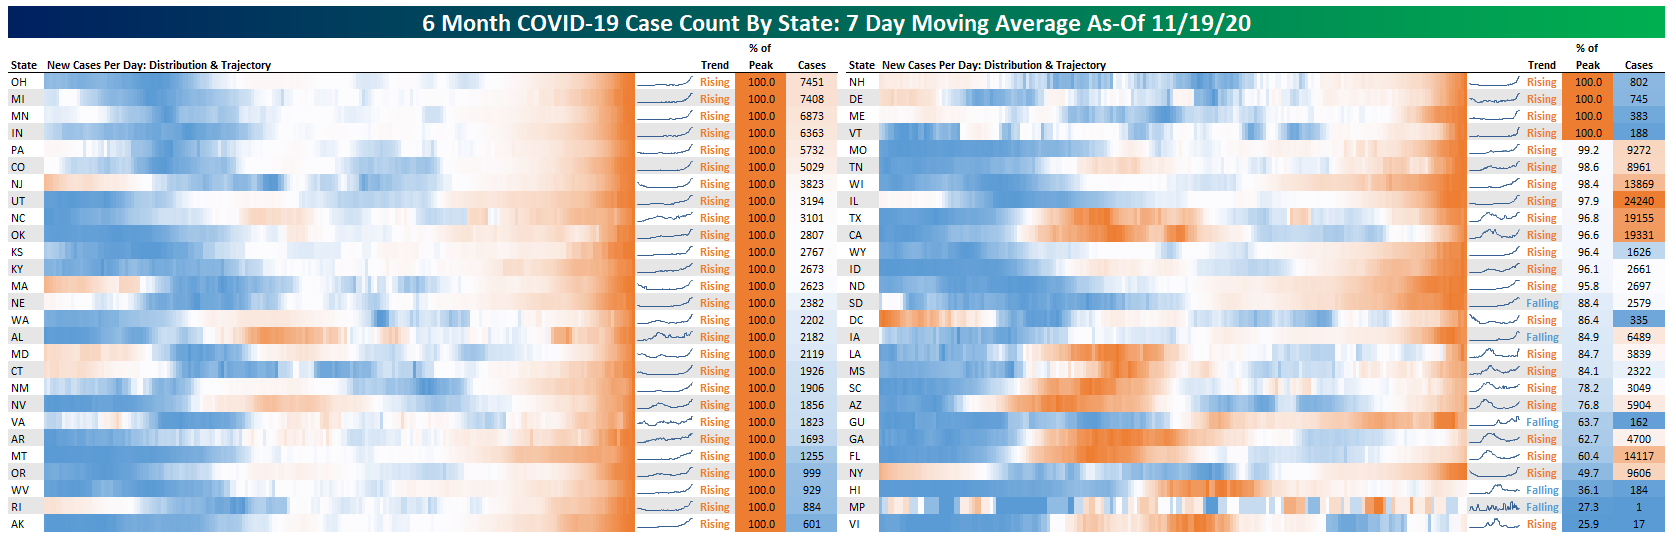
Switching to a granular look at states, below we show a table of state deaths, cases, tests, and positive test rate. We adjust for population on the right side of the table to make comparisons across states like-for-like. One note on positive test rates and test counts: some states under-report the actual number of tests run, so not all of these numbers can be taken at strictly face value. This table is still quite useful in seeing where testing, cases, positive test rate, and deaths sit across the country for the period ending on November 19th.
Another way to look at state performance is to compare tests over time. In the table below we show state 7 day average daily positive tests indexed to their peak (which in most cases is the current level). This allows a view of where the pandemic is currently worst versus the last six months. This helps to illustrate the national breadth of this massive increase in new cases currently underway.
We have a similar chart for hospitalization rates. Hospitalization rates are not subject to vagaries of test counts, and while they tend to lag new positive tests as an indicator of COVID’s spread, they are closer to real-time than deaths, which lag hospitalization rates. As shown, a number of states have over 400 people hospitalized per million population, and in all but a very few cases, hospitalization is rising, mostly quite quickly. Anything under a few hundred hospitalizations per million population isn’t a sign of stress on health care systems, but above 300-400 hospitalizations per million, states generally start running out of beds. Surging resources can help, but there are practical limits on how many people can be hospitalized at once. With new cases continuing to accelerate, this is a bad sign, because hospitalizations tend to lag new case counts.

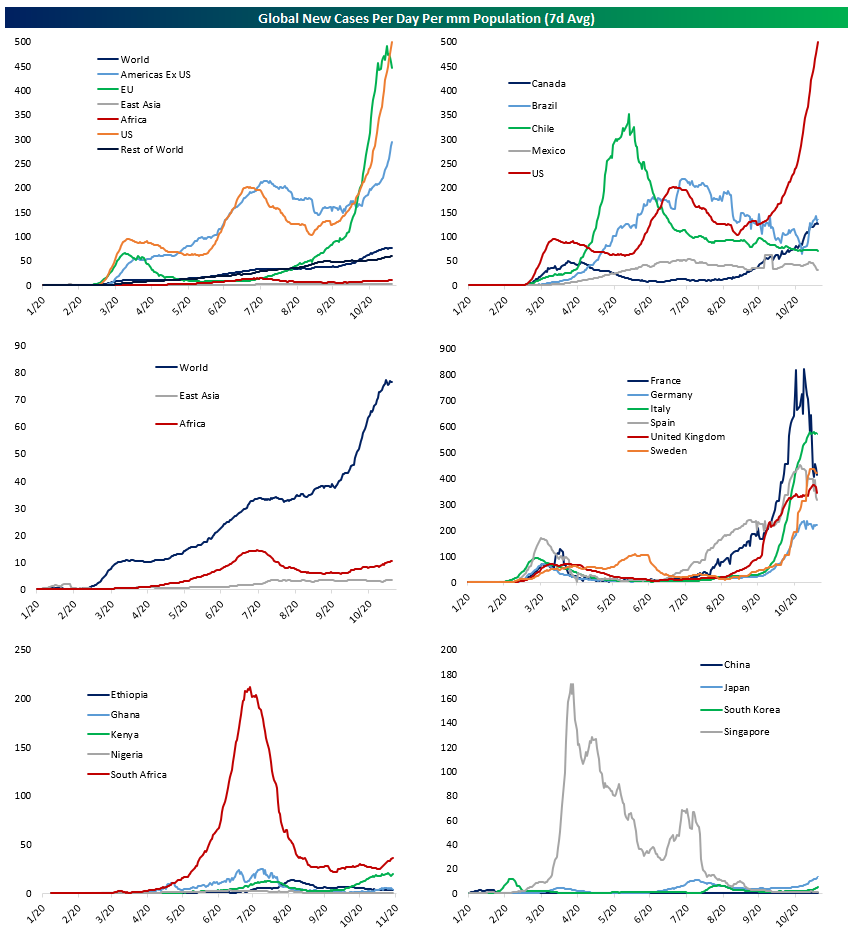
Below we show charts of new cases relative to population for a variety of regions and countries across the world at large. European cases spiked just ahead of the US. That includes Sweden, which introduced restrictions for the first time this fall amidst rising hospitalizations. We update these charts and the analysis that goes with them every morning in our pre-market report The Morning Lineup. Click here to start a free trial to Bespoke Institutional and receive our daily Morning Lineup for the next two weeks, featuring more commentary and data on macro markets.
Economic Activity Holding Up Okay Despite COVID Surge
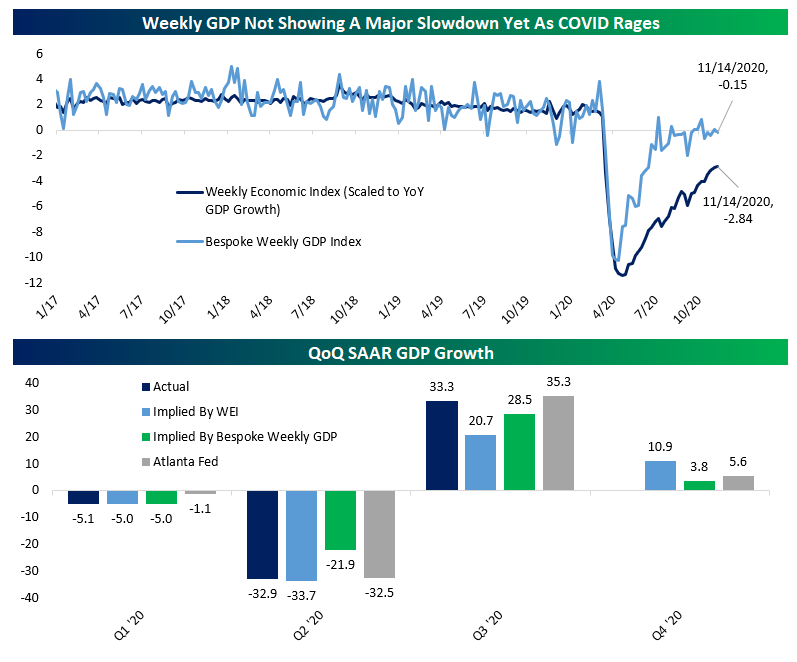
Below we update weekly economic growth trackers that we produce internally as well as the New York Fed’s Weekly Economic Index which is updated on a regular basis. Over the last five weeks, our index has reported negative YoY growth in output in four weeks, including a modest drop for the most recent week of data. For its part, the Weekly Economic Index has continued to rebound from the April lows and is at its highest levels since the March economic data collapse. That index still shows output down almost 3% YoY, but its ongoing rebound is suggesting a much stronger Q4 than what our index is tracking. Our data suggests output will be up a modest 3.8% QoQ SAAR in Q4, versus more than 10% QoQ SAAR forecasted by the WEI data. For context, Atlanta Fed GDPNow data suggests something more in-between, with their data tracking 5.6% QoQ SAAR. This analysis is published regularly in our post-market daily note The Closer. Click here to start a free trial to Bespoke Institutional and receive our daily Closer report for the next two weeks, featuring more commentary and data on macro markets.
Existing Home Sales Blow The Doors Off
The housing market continues to blow the doors off, with total annualized existing home sales coming in at a rate of 6.85mm in October, including 6.12mm single family units. Those numbers are only 5.7% and 3.5% respectively below the record levels from the housing bubble of the mid-2000s. Check out the enormous numbers recently in the chart below:

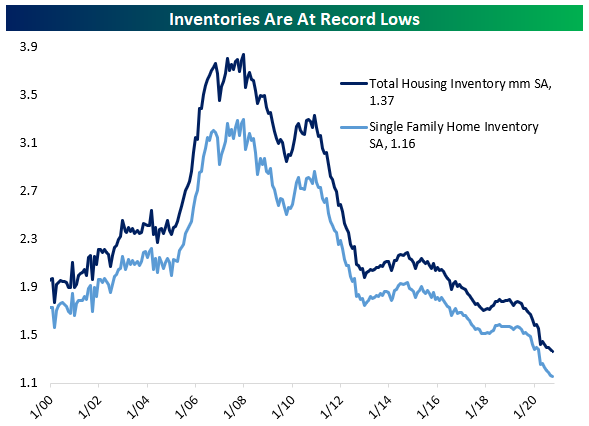
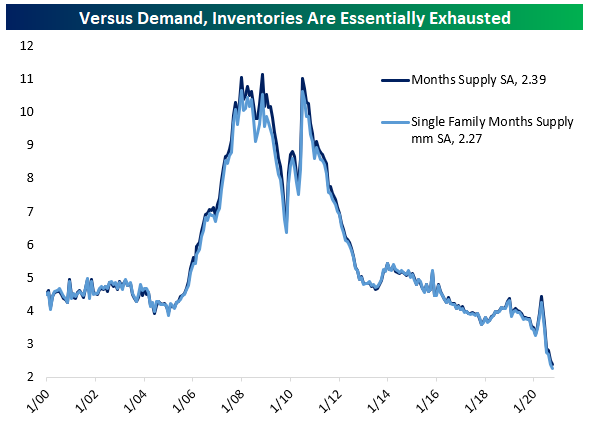
Unlike during the prior housing bubble, inventories are extremely low now both on an absolute basis (down 20% YoY for all homes and 23% YoY for single family) and relative to demand; both total existing and single family home inventories are below 2.4 months of demand. Inventories relative to demand are half of what they were at the last housing market peak on a months’ supply basis.
With so much demand for homes and so little supply, prices have exploded higher in the past few months. After adjusting for seasonality, prices are up a staggering 15% since the May lows, driven by both strong demand and a shift in mix towards higher-priced homes. This analysis was initially published in our post-market daily note The Closer. Click here to start a free trial to Bespoke Institutional and receive our Closer report and much more for the next two weeks, featuring more commentary and data on macro markets.
