Daily Sector Snapshot — 12/1/20
B.I.G. Tips – November 2020 Decile Analysis
November 2020 Asset Class Performance
The S&P 500 had its best November since 1928 with a gain of 10.75%. Below is a snapshot of our asset class performance matrix showing total returns across US-listed ETFs. Of the major US index ETFs, SPY was actually up the least in November with a gain of 10.88%. The S&P Smallcap 600 (IJR) and the Russell 2,000 (IWM) were up nearly twice that with gains of more than 18%.
Of the major sectors, Energy (XLE) was up by far the most in November but you’ll notice that it’s still down 35% year-to-date. The Financial sector (XLF) was up the second most in November with a gain of 16.85%, but like Energy, it too is still in the red on the year. Utilities (XLU) had the worst month with a gain of just 0.74%.
Outside of the US, four countries gained more than 20% — Brazil (EWZ), France (EWQ), Italy (EWI), and Spain (EWP). All four of these countries still finished November in the red for the year. India (PIN) and China (ASHR) were up the least of the countries listed with gains of 8% and 6.95%, respectively.
Looking at commodity ETFs, oil (USO) had a banner month with a gain of 22.65% while natural gas (UNG), gold (GLD), and silver (SLV) were all solidly in the red. For the year, though, USO remains down 69.8%. Finally, the various fixed income ETFs in our matrix were all up slightly on the month. The long-term Treasury ETF — TLT — remains up nearly 20% on the year, which easily beats the S&P 500 by more than five percentage points. Click here to see Bespoke’s premium membership options and start a free trial for instant access to our research and interactive tools.

Headcounts Hurting
Today’s ISM report pointed to broad improvements in the manufacturing sector in November, albeit there were some slowdowns in areas like New Orders, Production, and worst of all Employment. The index for Employment saw the sharpest decline falling 4.8 points from an expansionary reading of 53.2 in October to a contractionary 48.4 in November. That decline was in the bottom 5% of all month over month changes. Taking a more granular look, 18.9% of companies reported a lower number of workers (compared to 17.7% last month) whereas 14.8% reported a higher number (23.1% in October). 66.4% reported no change in the number of employees, up from 59.3% last month.
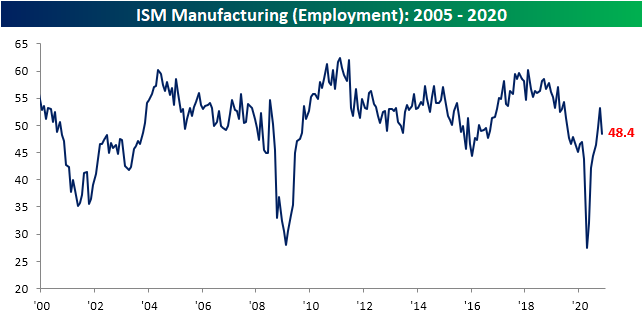
That reading at face value may be a bit of a worrying sign as it points to more companies reporting lower rather than higher headcounts. That also goes counter to other parts of the ISM report which pointed to further growth in demand and production. Some explanation can be found at least anecdotally through the comments section though. As shown below, rather than firms mentioning that they are laying off workers, the verbiage more often points to troubles in hiring. For example, there are mentions of “labor shortages” as “finding new people is an issue”. Put differently, there is anecdotal evidence that the manufacturing labor market is facing a supply instead of a demand issue. As a result of these shortages, firms report that there have been production constraints while demand has been strong. Click here to view Bespoke’s premium membership options for our best research available.

Manufacturer Recovery Continues
This morning, the Institute for Supply Management (ISM) released a less positive outlook for the US manufacturing sector. The headline number for ISM’s Manufacturing index fell from 59.3 last month down to 57.5. A drop was expected, but the actual results were worse than the drop to 58.0 that had been forecasted. That reading indicates that the manufacturing sector continued to grow in November but at a slower rate than October.

Similar to the various Federal Reserve bank surveys from around the country, breadth in the November report was more negative than in recent months. Of the ten indices excluding the headline number, only three were higher in November: Backlog Orders, Supplier Deliveries, and Export Orders. Additionally, two indices—Customer Inventories and Employment—showed contractionary readings.

One theme of the report was that orders remain very healthy. New Orders fell from 67.9 to 65.1, but that is a sixth consecutive month of expansionary readings. Although the index was lower this month, meaning new order growth decelerated, it remains in the top decile of historical readings. As new orders have continued to grow, so too have backlogs. The index for Backlog Orders has continued to press higher, rising to 56.9 from 55.7. That is in the 88th percentile of all months and is now at the highest level since August of 2018. Demand continues to improve with new orders coming in at a historically strong pace, even though it is slower than last month, and order backlogs have once again risen as a result.

As new order growth decelerated, so too did production. The index fell from 63.0 in October to 60.8 last month. That is still consistent with growth (readings above 50) in production but at the slowest rate since June. One factor that potentially had an impact on the slowdown in production is issues with suppliers. The index for Supplier Deliveries rose for the fourth month in a row in November and reached the highest level since May. Higher readings in the Supplier Deliveries index indicates longer lead times and vice versa. In other words, products from suppliers have been taking longer to reach manufacturers, in turn, impacting productivity.

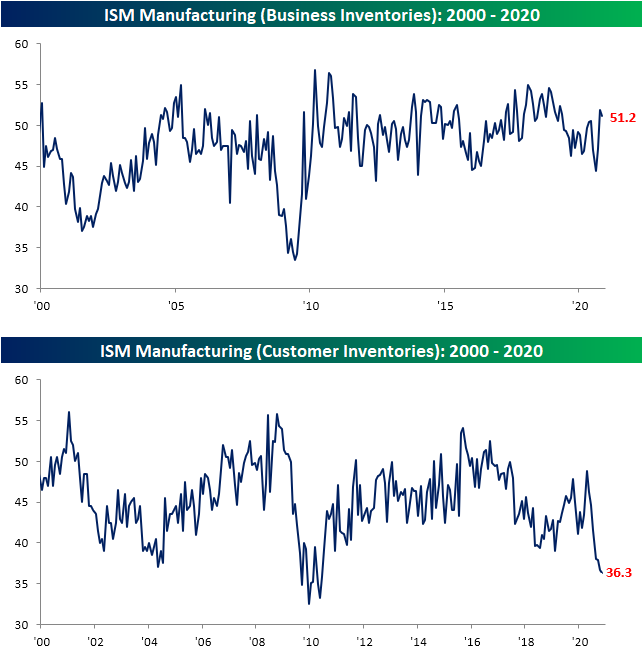
Although suppliers appear to have some constraints and production has slowed slightly, business inventories rose for the second month in a row even as more and more firms report that customer inventories are too low. The index for Customer Inventories now sits in the bottom 2% of historical readings after dropping another 0.4 points in November. At 36.3, the index is at the lowest level since June of 2010. That low reading can be considered positive for future production. Click here to view Bespoke’s premium membership options for our best research available.
Bespoke Stock Scores — 12/1/20
Bespoke Market Calendar — December 2020
Please click the image below to view our December 2020 market calendar. This calendar includes the S&P 500’s average percentage change and average intraday chart pattern for each trading day during the upcoming month. It also includes market holidays and options expiration dates plus the dates of key economic indicator releases. Start a two-week free trial to one of Bespoke’s three research levels.
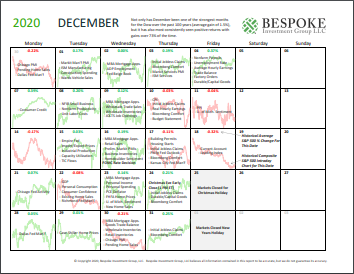
Chart of the Day: December Intra-Month Returns
November 2020 Headlines
Stocks and Bonds Both in Rally Mode
When it comes to equity market performance in a given month, it doesn’t get much better than November. While the S&P 500’s total return of 10.95% in the month was only the second-best monthly performance of the year, it was still enough to rank as the third-best month for the S&P 500 in the last thirty years and just the ninth month since 1980 that it was up 10%+.
The chart below shows the S&P 500’s annualized total return over the last one, two, five, ten, and twenty years and compares the current returns to the historical average. For the last year, the S&P 500’s total return has been 17.5% which is nearly six full percentage points higher than the historical average. For the last two years, the annualized return has been nearly as strong at 16.8%, and it is actually even stronger relative to the historical average of 10.5%. Moving further out the time horizon, the S&P 500’s annualized returns drift lower, and while the five and ten-year annualized returns are greater than average, the S&P 500’s annualized gain of 7.3% in the last 20 years is more than 3.5 percentage points below the historical average of 10.9%.

The last couple of years haven’t just been strong for equities. Over the last year, long-term US Treasuries, as measured by the Merrill Lynch 10+ Year US Treasury Index, have rallied 15.7%, which is more than six full percentage points greater than the historical average of 9.5%. Over the last two years, returns have been even stronger with an annualized gain of nearly 20%, or more than double the historical average of 9.1%! While the last two years have been strong for US Treasuries, the last five, ten, and twenty years have all seen returns of between one and two percentage points below their historical average.

Lately, when you see rallies in the equity market, it tends to be accompanied by a decline in treasuries as yields rise. In November, though, that wasn’t the case. Even with the S&P 500 up 10.95%, long-term US Treasuries rallied just over 1%. So how uncommon is it for stocks to rally like they did in November while bonds also rally. Actually, it is not very uncommon at all. The table below shows the nine months since 1980 where the S&P 500’s total return in a given month was 10% or more, and of those months, long-term treasuies also rallied in every month but one (October 2011). Click here to view Bespoke’s premium membership options for our best research available.
