Country ETFs’ Drawdowns and Rebounds
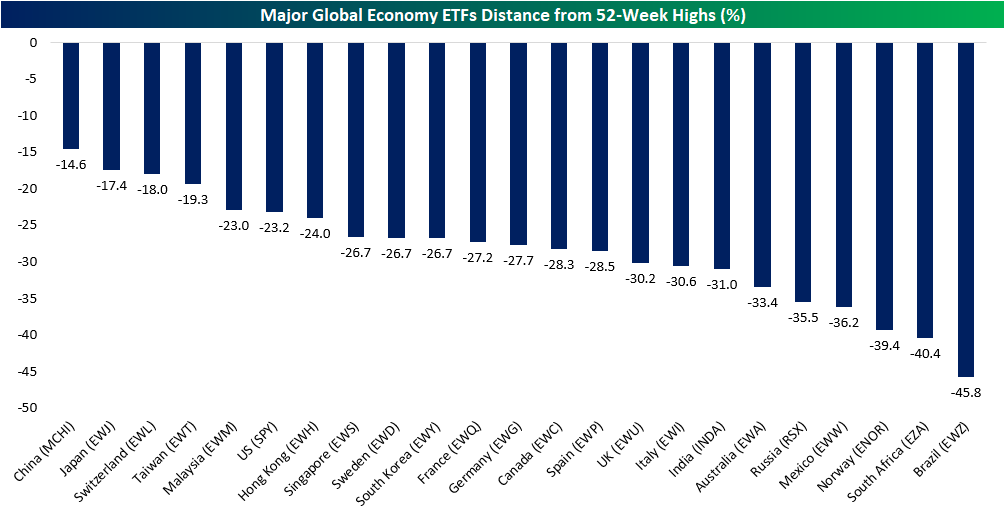
The COVID-19 pandemic has impacted equity markets around the globe. As shown in the table below, the equity markets of all the major global economies tracked in our Global Macro Dashboard (using each country’s ETF as a proxy) are all well off their 52-week highs with only four—Taiwan (EWT), Switzerland (EWL), Japan (EWJ), and China (MCHI)—less than 20% away from the past year’s high. While not as close as those four, the US is actually one of the countries that is closest to its recent high; down ‘just’ 23.2% after this week’s rally. Brazil (EWZ), on the other hand, is currently the furthest below its 52-week high at 45.8%.
The S&P 500 (SPY) peaked on February 19th and was down 34.1% from there at Monday’s close. Including SPY, that Monday close has marked at least a temporary bottom for a number, though not all, of these country ETFs. Since then, SPY has risen over 15% and that is actually on the lower end of these countries’ performance. The chart below shows how much each country’s ETF has rallied off of their respective lows since the global sell-off began on 2/19. Russia has seen the biggest rebound having risen 28.18%. Granted, it also bottomed ahead of other countries putting in its low on March 18th. Even though it is down the most off of its 52-week high, Brazil is also one of the best performers since its low on Monday. South Africa and Canada have also risen more than 25% since their lows on Monday. Start a two-week free trial to Bespoke Institutional to access our Global Macro Dashboard and our full range of research and interactive tools.

Sentiment Remains Bearish
Even though equities are rallying considerably this week, sentiment has been little changed. That’s likely a function of the timing of this week’s survey and the massive volatility. 32.9% of respondents in AAII’s weekly sentiment survey reported as bullish this week. That’s little changed from 34.4% last week. Meanwhile, the percentage of equity newsletter writers reporting as bullish in the Investors Intelligence survey has continued to fall with just over 30% reporting as bulls this week. That is the lowest level since the first week of 2019. Prior to that, there have only been 29 other weeks since 1997 with lower readings.


The results are similar for bearish sentiment. AAII’s survey saw bearish sentiment rise slightly from 51.1% last week to 52.07% this week. Bearish sentiment has now been above 50% for three consecutive weeks. That is the first time this has happened since March of 2009. Back then readings above 50% persisted for four weeks straight. Outside of that 2009 occurrence, the only other times that bearish sentiment remained above 50% for three weeks or more was in January, March, and July of 2008 and the late summer and fall of 1990. As for the Investors Intelligence survey, 41.7% are reporting as bearish which is the highest level since October of 2011. This week’s reading is in the 96th percentile of all readings in the history of the survey.
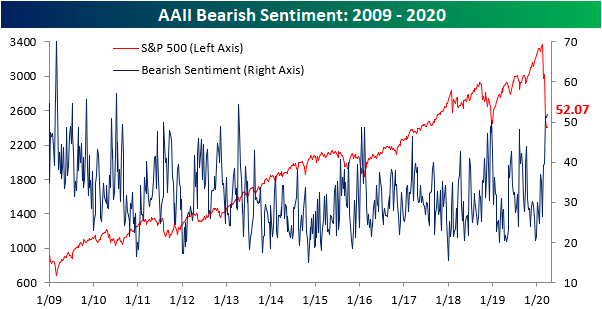

Neutral sentiment picked up about half of a percentage point this week to 15.03%. With the majority of investors reporting as bearish, this very low reading is in just the second percentile of all readings in the history of the survey. Start a two-week free trial to Bespoke Institutional to access our interactive economic indicators monitor and much more.

Bespoke’s Sector Snapshot — 3/26/20
B.I.G. Tips – Some ‘Semi’ Positive News
Chart of the Day: Aiming With AECOM
Records All Around Claims
No one was expecting a strong number for jobless claims this week as forecasts were predicting claims to come in at a record high. The median forecast was calling for claims to total 1.7 million compared to 282K last week which had been the highest reading since September of 2017. Instead, they practically doubled those forecasts coming in at a record 3.283 million. Fortunately, that was less than some of the most aggressive estimates like Citigroup which forecasted claims to be 4 million. This week’s data is an unprecedented albeit anticipated jump in jobless claims. To put the size of the number into perspective, that is roughly 1% of not the US working population, but the entire US population! In the history of the data going back to 1967, there has never been a higher number in the level of claims (first chart below) or week-over-week change (second chart below). The previous high for jobless claims was 695K from October of 1982, almost one-fifth of this week’s print. As for the week to week changes, the over 3 million increase in claims blew the size of the previous largest movements out of the water.

The four week moving average typically helps to smooth out the week to week fluctuations of the high-frequency data, but considering the size of the move, the utility of the moving average is fleeting this week. The moving average has also reached a record high and experienced the largest one week increase on record.

While it may not be much consolation given how horrific this week’s numbers are, one silver lining is in the non-seasonally adjusted number. Before seasonal adjustment, jobless claims were slightly less staggering at 2.898 million. In other words, seasonal factoring does make the number of claims look higher than the actual amount reported. But that is still the largest weekly increase and highest number on record regardless of any seasonal patterns that may be affecting the number. Given more workers are continuing to stay home than return to work these numbers are likely to keep rising over the coming weeks. Start a two-week free trial to Bespoke Institutional to access our interactive economic indicators monitor and much more.

Bespoke’s Morning Lineup – 3/26/20 – Yowza
See what’s driving market performance around the world in today’s Morning Lineup. Bespoke’s Morning Lineup is the best way to start your trading day. Read it now by starting a two-week free trial to Bespoke Premium. CLICK HERE to learn more and start your free trial.
We’re looking at a 1% decline in the US equity market, which wouldn’t actually be that bad given all the volatility we have had lately. Any moves in the market that would represent a more normal trading pattern would be welcome in our view. The big events so far today came from DC where the Senate unanimously passed the $2 trillion relief package. From a market perspective, the big news wasn’t from CNBC or Bloomberg but instead the ‘Today’ show where Fed Chair Powell conveyed the message that the Fed is “not going to run out of ammunition” and that the Fed “still has policy room.”
Read today’s Bespoke Morning Lineup for a discussion of the latest trends and statistics of the outbreak and overnight moves in the market.

They say a picture is worth a thousand words, and this one doesn’t really need much in the way of explanation. Everyone was expecting a surge in claims this week, but the actual increase was more than double expectations as claims came in at 3.283 million versus estimates for 1.7 million That was basically double economist expectations and more than 10x more than the prior week. Just to put this reading in perspective, it works out to 1% of the US population. Not the working population, but the entire population!

The Closer – Bounced But Not Forgetting – 3/25/20
Log-in here if you’re a member with access to the Closer.
Looking for deeper insight on markets? In tonight’s Closer sent to Bespoke Institutional clients, we recap the second day of “dash for trash” including the bounce in homebuilders and mortgage REITs. We then delve into the MBS market before turning over to weekly ICI fund flows. Afterward, we look at the EIA’s weekly petroleum data and the results of today’s 5 year note auction.

See today’s post-market Closer and everything else Bespoke publishes by starting a 14-day free trial to Bespoke Institutional today!
Daily Sector Snapshot — 3/25/20
Boeing (BA) Sends the Dow Flying
Turnaround Tuesday has carried into hump day with the Dow up well over 5% again today as of this writing. As we mentioned in an earlier post, that means the Dow is on track for its first back-to-back up days for the first time since early February. Remarkably, even with only two consecutive up days, the index is closing in on exiting a bear market. For that to happen, the Dow would need to close above the 22,310.32 level which is 20% off of the bear market closing low (Monday’s close at 18,591.93). At today’s high, the Dow was less than 300 points or 1.32% from that level.
As for the individual stocks contributing to the rally, Boeing (BA) deserves a lot of thanks. The stock has been hit very hard during the sell-off. Whereas the stock has traded in the mid-$300 for much of the past two years and up to mid-February, as of late last week BA had fallen below $100. That massive drop in price means that day to day movements in the stock would have a lesser impact on the level of the price-weighted Dow. In spite of this, BA has contributed over 400 points to the Dow’s rally in the past two days alone! That is much more than any other stock in the index with the next biggest contributor being UnitedHealth (UNH) who’s 335.44 point contribution comes as its share price is currently around $100 more than BA. BA’s contribution is also almost 200 points more than those of McDonald’s (MCD), Visa (V), and Apple (AAPL). Of all 30 Dow stocks, there is only one that is down over the past couple of days, subtracting from the index’s rally: Walmart (WMT). Given WMT has held up fairly well recently, its performance is yet another example of investors’ focus on the more beaten down names that we have noted earlier today and in last night’s Closer. Start a two-week free trial to Bespoke Institutional to access Closer and full range of research and interactive tools.
