The Bespoke Report – Roaring or Boring?
This week’s Bespoke Report newsletter is now available for members.

To read the report and access everything else Bespoke’s research platform has to offer, start a two-week free trial to one of our three membership levels. You won’t be disappointed!

Daily Sector Snapshot — 3/12/21
Households’ Equity Market Exposure Continues To Rise
Last night the Federal Reserve updated its quarterly Flow of Funds (Z.1) report for Q4. The quarterly report measures income, savings, assets, and liabilities of various macroeconomic sectors. Looking at households specifically, we can measure aggregate exposure to stocks by looking at their holdings of equity investments relative to other assets. We note that this does not include mutual fund shares but it does include ETFs, closed-end funds, and REITs.
As shown below, the value of equity market assets held by households is up to 16.8/% of total assets, the highest since Q3 of 1969 and surpassing the 16.7% peak from the tech bubble. Looking at financial assets only, equity exposure is the highest since the 24.2% peak from 2000, but is nonetheless extremely elevated. We should note that while this signal is certainly a contrarian indicator, it doesn’t necessarily mean that equity markets must decline in value; there’s no reason that markets can’t continue to climb and raise the share of equity ownership further.

Things look different when we include household holdings of mutual funds and other exposure to equities. In the chart below we account for indirect allocations to equities. By this measure, Q4 equity market exposure rose to 38.0% of financial assets (versus the Q1 2000 peak of 38.3%). Equity exposure as a percentage of all financial assets hit a record, surpassing the old peak of 26.4% with a 27.0% reading in Q4. In short, households are very aggressively exposed to equity markets. This blog post is adapted from an analysis included in our nightly Closer report. Click here to start a free trial of Bespoke Institutional to get immediate access.

Bespoke’s Morning Lineup – 3/12/21 – More Yield Drama
See what’s driving market performance around the world in today’s Morning Lineup. Bespoke’s Morning Lineup is the best way to start your trading day. Read it now by starting a two-week free trial to Bespoke Premium. CLICK HERE to learn more and start your free trial.
“If you work really hard, and you’re kind, amazing things will happen.” – Conan O’Brien
With US Treasury yields rising overnight, tech stocks are under pressure this morning, while DJIA futures are higher as shares of Boeing (BA) are taking off in the pre-market. At current levels, the 10 and 30-year US Treasuries are on pace to close at post-pandemic highs in terms of yields. The only other report on the calendar this morning is Michigan Confidence at 10 AM.
Be sure to check out today’s Morning Lineup for updates on the latest market news and events, including a recap of moves in the rates market overnight, an update of moves in the Asian and European market, European Manufacturing, an update on the latest national and international COVID trends, including our series of charts tracking vaccinations, and much more.

Overall breadth in the market has and continues to be strong. This morning’s example comes from the percentage of S&P 500 Industry Groups trading above their 50 and 200 moving averages. Starting with the percentage of Industry Groups above their longer-term 200-DMA, that reading currently stands at just above 90%. During the recent equity market sell-off, that reading dropped down to as low as 75.0% but has rebounded back towards its recent highs.

Relative to the shorter-term 50-DMA, the breadth reading isn’t quite as strong but still stands at a healthy two-thirds and is up from under 50% during the recent sell-off. Obviously, this is a more volatile reading, but the longer it churns around the 50% level, the more likely it is that we see these lower readings start to drag down the strong readings in the percentage of groups above their 200-DMA. Not much of a worry yet, but something to watch going forward.

Bespoke’s Weekly Sector Snapshot — 3/11/21
Two Sentiment Surveys Go In Opposite Directions
As equities have rebounded in the past week with the S&P 500 and Dow returning to all-time highs today, sentiment has gotten a boost. After falling in back-to-back weeks, bullish sentiment as measured by the AAII’s weekly survey snapped back rising 9.1 percentage points to 49.4%. That was the biggest one-week increase since the week of November 12th when it rose 17.88 percentage points, and it is also the highest level of bullish sentiment since then.

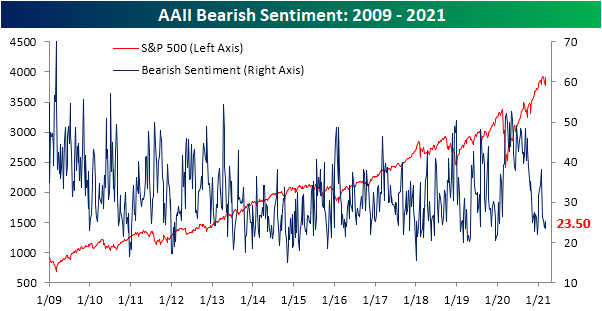
The declines in bullish sentiment of the prior two weeks saw neutral rather than bearish sentiment pick up the difference. This week again bearish sentiment went less changed than bullish or neutral. Bearish sentiment was only slightly lower falling 1.8 percentage points to 23.5%. That is the lowest level of bearish sentiment since the second to last week of 2020 when it bottomed out at 21.99%.
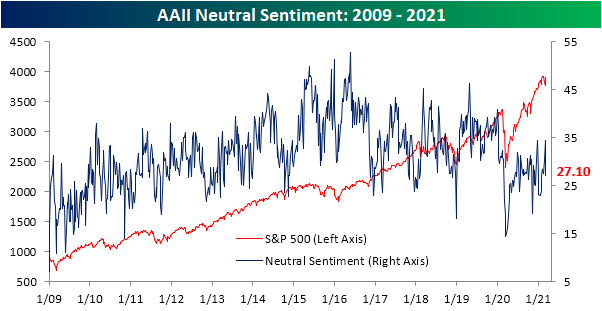
That means the gains in bullish sentiment took from the big decline in the percentage of respondents reporting as neutral. Only 27.1% of respondents reported as neutral this week, down 7.3 percentage points from the prior week. That was the largest single-week decline since the end of 2020 as sentiment is back to the same level as the start of February.
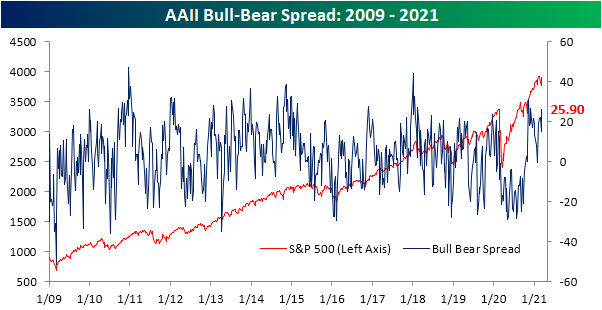
These changes in sentiment have meant that the bull-bear spread took a sharp move higher rising to 25.9. That is the highest level in the spread since the first week of December when it was slightly higher at 26.41. Prior to that, the only recent reading that was as high was November 12th which was the highest level in over two years.
While the AAII’s survey has reflected the bounce in equities over the past week, another sentiment survey is not yet reflecting this week’s price action. The Investors Intelligence survey of equity newsletter writers showed bullish sentiment fell 2.9 percentage points to 51%. That is the lowest level since the end of last May when it was 50.5%. Meanwhile, bearish sentiment rose 2 percentage points to 20.6%; the highest since early November. This survey also queries respondents on whether or not they are looking for a correction. With the Nasdaq having met the technical definition of a correction earlier this week (a 10% decline from a high), it’s not surprising that the highest share of respondents, 28.4%, reported that they are looking for a correction since late September. Click here to view Bespoke’s premium membership options for our best research available.

The Bespoke 50 Top Growth Stocks — 3/11/21
Every Thursday, Bespoke publishes its “Bespoke 50” list of top growth stocks in the Russell 3,000. Our “Bespoke 50” list is made up of the 50 stocks that fit a proprietary growth screen that we created a number of years ago. Since inception in early 2012, the “Bespoke 50” is up 471.7% excluding dividends, commissions, or fees. Over the same period, the Russell 3,000’s total return has been +245.6%. Always remember, though, that past performance is no guarantee of future returns. (Please read below for more info.) To view our “Bespoke 50” list of top growth stocks, please start a two-week trial to either Bespoke Premium or Bespoke Institutional.
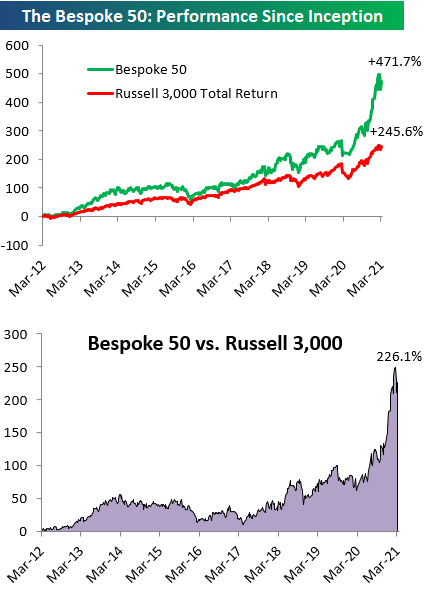
The Bespoke 50 performance chart shown does not represent actual investment results. The Bespoke 50 is updated weekly on Thursday. Performance is based on equally weighting each of the 50 stocks (2% each) and is calculated using each stock’s opening price as of Friday morning each week. Entry prices and exit prices used for stocks that are added or removed from the Bespoke 50 are based on Friday’s opening price. Any potential commissions, fees, or dividends are not included in the performance calculation. Performance tracking for the Bespoke 50 and the Russell 3,000 total return index begins on March 5th, 2012 when the Bespoke 50 was first published. Past performance is not a guarantee of future results. The Bespoke 50 is meant to be an idea generator for investors and not a recommendation to buy or sell any specific securities. It is not personalized advice because it in no way takes into account an investor’s individual needs. As always, investors should conduct their own research when buying or selling individual securities.
Jobless Claims Weaker Under The Surface
After a small uptick last week, initial jobless claims have resumed their move lower coming in at 712K this week and 13K below expectations. The 42K decline from last week’s upwardly revised reading (745K previously to 754K) entirely erased the prior week’s 18K increase as claims now stand just 1K above the pandemic low of 711K reached in the first week of November. While that is still a historically elevated reading, it is only within 17K of the pre-pandemic record of 695K.

While the adjusted number is just off the pandemic low, on a non-seasonally adjusted basis claims did reach a new low. At 709.5K, claims have taken out the previous 716.6K low from two weeks ago. From a seasonal perspective, declines during the current week of the year are the norm. Historically, the current week of the year (10th) has seen claims fall two-thirds of the time.

Adding in Pandemic Unemployment Assistance (PUA), the improvement in claims data was less impressive. PUA claims were actually higher by 41.86K on a week over week basis bringing total claims between that program and regular state claims to 1.188 million from 1.193 million last week. That is still roughly 181K above the pandemic low from early November and little changed from the past few weeks’ readings.
On a state-level basis, while a majority of states continue to report lower initial claims for both programs, the single biggest contributor to national claims continues to be Ohio. Ohio reported 126.9K regular state claims which is 20K more than the next biggest contributor, California (105.9K). For PUA claims, Ohio’s 261.7K claims in the most recent week are over 45K more than the combined total PUA claims for all other states and territories. For continuing claims, things are a bit less extreme with Ohio only accounting for 4.13% of all regular state continuing claims and 8.67% of total PUA continuing claims.

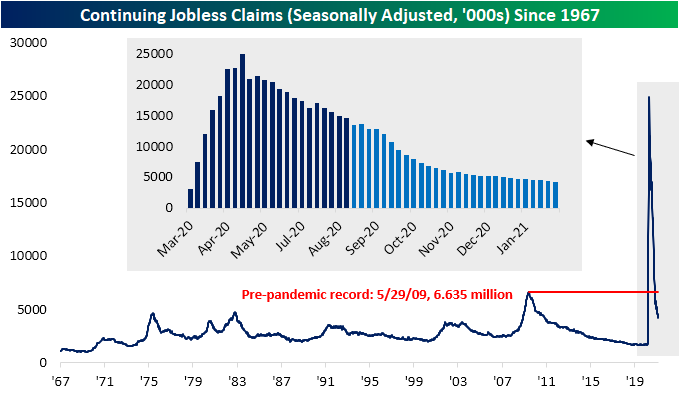
Like initial claims, continuing claims have also continued to improve, coming in below expectations (4.144 million vs. 4.2 million expected) which was also a new low for the pandemic. The 193K decline was the eighth weekly decline in a row as claims have fallen every week except for three in the past half-year.
Including all programs adds an extra week’s delay to the data. For the data as of the week of February 19th, total claims were an entirely different story as they rose by over 2 million rising back above 20 million for the first time since early December. That week saw an uptick across programs, but the biggest factors were PUA claims and Pandemic Emergency Unemployment Compensation (PEUC) which rose by 1.058 million and 986.35K, respectively. For PUA claims, that was the largest increase since January 8th when there was some catch-up following the signing of the spending bill. Click here to view Bespoke’s premium membership options for our best research available.


Chart of the Day: Tech Exposure To Rates At A Record
Bespoke’s Morning Lineup – 3/11/21 – Five in a Row?
See what’s driving market performance around the world in today’s Morning Lineup. Bespoke’s Morning Lineup is the best way to start your trading day. Read it now by starting a two-week free trial to Bespoke Premium. CLICK HERE to learn more and start your free trial.
“The key to making money in stocks is not to get scared out of them.” – Peter Lynch
The Dow is looking to make it five in a row today as equity futures are higher across the board. Weekly jobless claims came in lower than expected on both an initial and continuing basis, and are also both at or near their lowest levels of the pandemic. Futures were already higher this morning, but dovish comments from ECB President Lagarde have boosted the mood even further.
Trends related to COVID continue to show improvement on both a national and international basis, as vaccine doses continue to pile up across the country. Also, news from Pfizer (PFE) suggesting strong (94%+) real-world effectiveness of its vaccine based on a study in Israel only makes the outlook for once those doses are administered more broadly even more optimistic.
Be sure to check out today’s Morning Lineup for updates on the latest market news and events, including a recap of Asian and European markets, the latest ECB rate decision, Japanese bond flows, an update on the latest national and international COVID trends, including our series of charts tracking vaccinations, and much more.
Looking at the chart of QQQ, it’s in a bit of limbo heading into today. Last week, the index appears to have successfully tested support at its peak from last September. Despite the bounce, QQQ still remains below its 50-DMA, and even after what is on pace to be a 2% gap at the open, it will still be trading below its 50-DMA. Large-cap tech still has some catching up to do!
