Chart of the Day: Brutal Quarter For Bonds Finally In The Rearview Mirror
Claims Miss Expectations But Sit Just Off Pandemic Lows
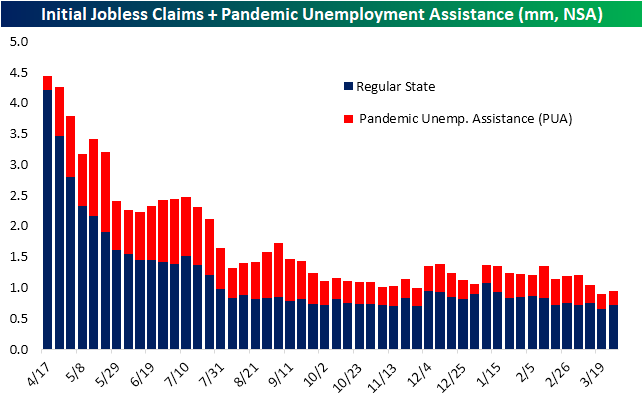
After coming in at a new low for the pandemic last week, a higher reading in initial jobless claims was expected this week with forecasts calling for a reading of 675K; up from a downward revision to 658K last week. Instead, claims rose by 61K to 719K. Although that is the biggest one-week increase since the second week of January when claims rose 123K, at 719K this week’s reading still managed to tie the last week of November for the second-lowest reading of the past year. Additionally, we would also note that this week is the first to reflect the annual revisions to the seasonal adjustment factors for both initial and continuing claims.

Unadjusted regular state claims were also higher rising from 651.2K last week to 714.4K. Again, this was the largest one-week increase since January. While regular state claims were weaker, Pandemic Unemployment Assistance (PUA) claims fell slightly to 237K. That sets a new low for the pandemic save for the first week that PUA claims debuted roughly one year ago and the first week of 2021 when there was the caveat that there were some lapses in claims as a result of the timing of the signing of the spending bill. Nonetheless, the larger uptick in regular state claims meant that, on a combined basis, claims did rise this week. Granted, at 951.4K total claims remained below 1 million in back-to-back weeks for the first time in the past year.
Like initial jobless claims, continuing claims also came in higher than expected (3.794 million vs. 3.75 million expected). While claims were above expectations, they did improve from last week’s reading of 3.87 million to set a new low for the pandemic. That also marked an eleventh consecutive week with lower continuing claims.
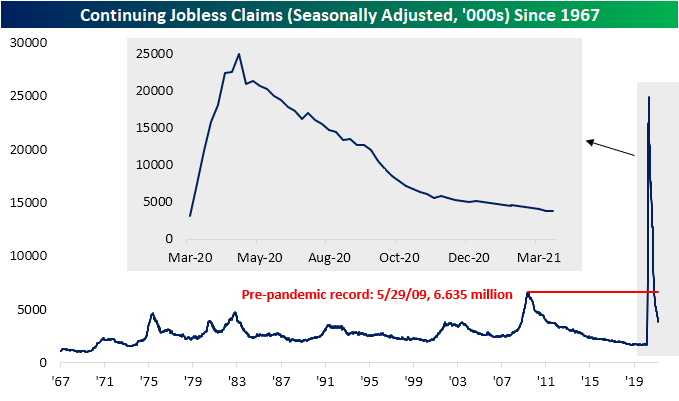
Factoring in all unemployment programs adds some lag to the data making the most recent data as of the week of March 12th. That week saw a broad decline across all programs as combined claims fell from 19.768 million to 18.247 million. The program that contributed the most to that decline was Pandemic Emergency Unemployment Compensation (PEUC) which fell by over 700K claims. That marks the program’s fourth-largest decline of the past year. Regular state and PUA claims also experienced significant declines.
Recently we have noted how a rising share of total claims belongs to programs like PEUC that extend benefits past the expiration of the regular benefit periods. For example, the previous week saw two of these programs, PEUC and Extended Benefits, account for 36.9% of all claims which was the highest level of the pandemic. That large decline in PEUC claims in the most recent week alongside a modest improvement in the Extended Benefits program resulted in that share declining by 1.1 percentage points. In other words, there is some evidence that there has been some improvement in the reading on people who are facing long-term unemployment. Click here to view Bespoke’s premium membership options for our best research available.


Bespoke’s Morning Lineup – 4/1/21 – A Fresh Start
See what’s driving market performance around the world in today’s Morning Lineup. Bespoke’s Morning Lineup is the best way to start your trading day. Read it now by starting a two-week free trial to Bespoke Premium. CLICK HERE to learn more and start your free trial.
“If the end doesn’t justify the means, what does?” – Robert Moses
One day after President Biden outlined his plans for infrastructure, we thought it fitting to turn to Robert Moses, the ruthless modern-day master of infrastructure, for today’s Quote of the Day. During the New Deal, when the Federal Government was looking for ‘shovel-ready’ projects, unlike most cities around the country that had ideas but no plans on how to implement them, Robert Moses was prepared and had both the ideas and the plans drawn up and ready to lay them out. As a result, New York City and the surrounding region received a large share of distributed funds. Ideas a good, but plans to implement them are just as, if not, even more important.
US futures are trading higher to kick off Q2 with Asia trading higher overnight and Europe also strong. Economic data from international markets has been strong as Manufacturing PMIs for the month of March continue to surge. The only US economic data so far today has been jobless claims, and on both an initial and continuing basis, the latest figures came in higher than expected.
Read today’s Morning Lineup for a recap of all the major market news and events including a recap of manufacturing economic data from around the world, a recap of international markets, the latest US and international COVID trends including our series of charts tracking vaccinations, and much more.

The first quarter of 2021 was a positive one for US stocks, but the quarter, like the majority of days in it didn’t end on a positive note. The S&P 500 finished the day in positive territory, but a last-hour sell-off clipped those gains considerably. Wednesday’s pattern was a microcosm of the pattern all year, where stocks open higher, rally throughout the trading day, and then sell-off in the last hour and into the close. How weak has the last hour of the trading day been? Well, throughout Q1, despite the S&P 500 trading higher on 54% of all trading days, the last hour was only positive 31% of the time! Relative to all other hourly intervals throughout the trading day, the last hour has been, by far, the least consistent to the upside.

Daily Sector Snapshot — 3/31/21
Asset Class Performance
The first quarter of 2021 came to a close on Wednesday, and while the first quarter of this year was not nearly as crazy as the first quarter of 2020, it was far from tranquil. Below we provide a snapshot of our ETF Asset Class Performance Matrix summarizing the total return of ETFs across the investment spectrum during the month of March, Q1, and for all of 2010.
Given the carnage we saw in some areas of the market recently, it may not seem that way but March was a very positive month for US equities across different styles and sectors. At the index level, the Dow led the way surging nearly 7%, but the S&P 500 was also very strong, gaining more than 4.5%. Large Cap Tech was an area of relative weakness, but even the Nasdaq 100 was up 1.71% (just about all of which came on the last trading day of the month). Continuing a trend that has been in place all year, value stocks left growth in the dust, more than doubling the gains of growth stocks during March. At the sector level, we saw both cyclicals and some defensives lead the way higher this month with Utilities rallying more than 10%, Industrials up 9%, Consumer Staples up 8.5%, and Materials up nearly 8%. While no sectors were down in March, Technology lagged the most by rallying ‘only’ 1.76%.
At the international level, it was a good month for North America as Mexico rallied 7.8% and Canada surged 5.8%. On the downside, the only country in the red for the month was China, which dropped 6.5%. What’s interesting to note about the performance of international markets is that like the US, a lot of areas that lagged in 2020 were leaders in March and vice versa for this year’s laggards.
While inflation has been a concern for investors lately, it’s interesting to note that all of the commodities in the matrix were down in March with Silver (SLV) and Natural Gas (UNG) falling the most. In the case of silver, while it was the second-best performing ETF in our matrix in 2020, it was the worst-performing ETF during the month of March.
Finally, fixed-income investors have had a rude awakening so far this year. While all of the fixed income-related ETFs saw positive returns in 2020, they’re all down so far in 2021. Long-term US Treasuries have been the biggest laggards as TLT is already down 13.9% YTD. So much for the ‘safety’ of Treasuries. Click here to view Bespoke’s premium membership options for our best research available.
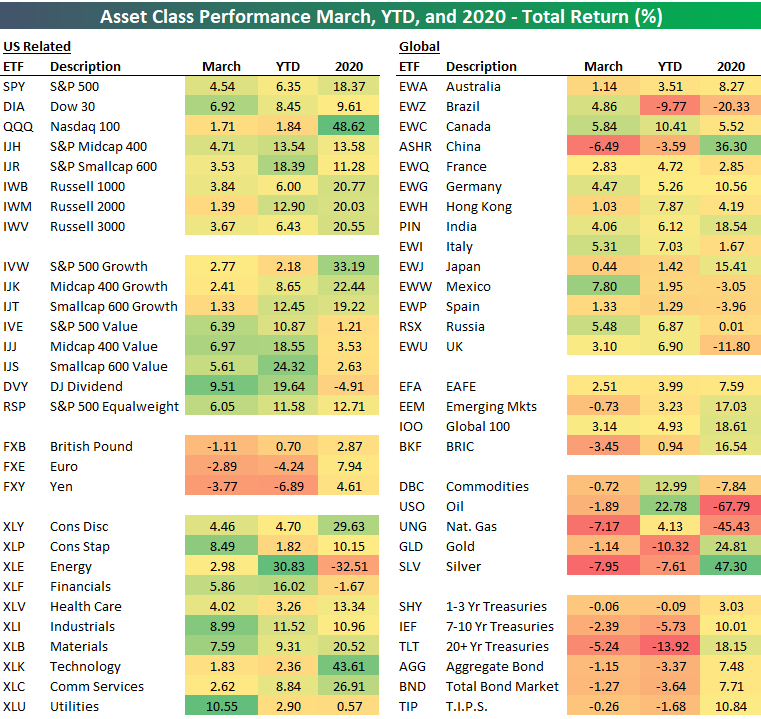
Chart of the Day: April 2021 Seasonality
Are the Financials and Energy Sectors Due for Rotation?
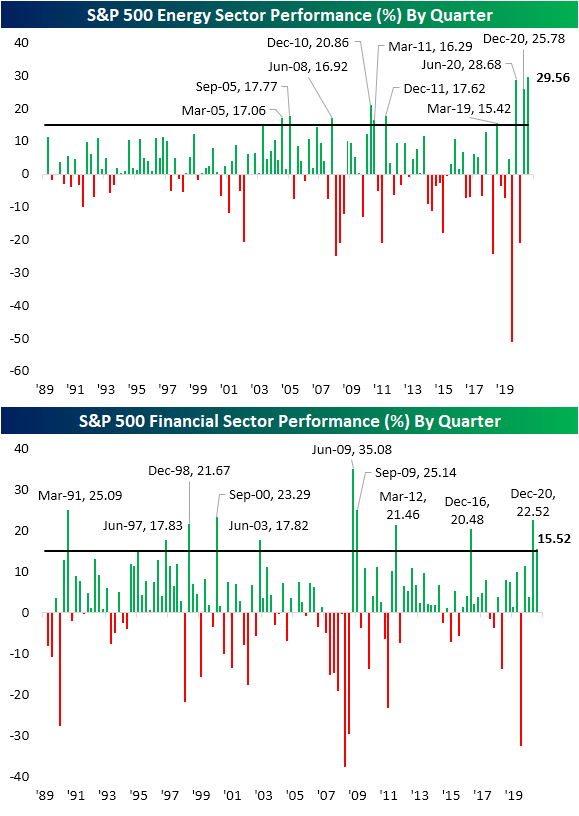
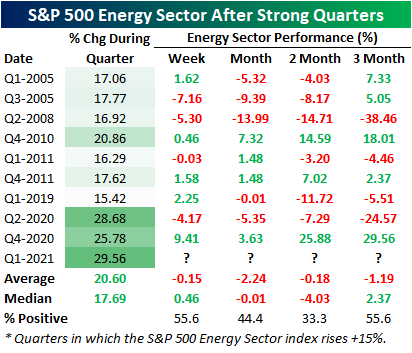
As we noted in today’s Morning Lineup and an earlier post, the Energy sector far and away has been the best performing S&P 500 sector in Q1. The sector is on pace to close out the quarter with a gain of just under 30%. That is nearly double the return of the next best performing sector: Financials. Granted, Financials have likewise been on an impressive run, gaining over 15%.
As shown in the charts below, going back to at least 1990, Q1 of 2021 is on pace to go down as the Energy sector’s single largest quarterly gain on record. Amazingly, the next two quarters that stand as runners-up have both come within the past year. Those were last quarter when the sector rose 25.78% and Q2 of 2020 when it rallied 28.68%. For the Financial sector, this quarter’s gain stands in the top decile of all quarterly moves of the past three decades, and that follows last quarter’s 22.52% gain which stands in the top 5%. As shown in the charts below, for both sectors, gains of 15% or more in a single quarter have been fairly uncommon with only a handful of past instances.
That brings to question if strong runs in one quarter result in rotation out of those sectors the following quarter. In the tables below, we show the performance of the Financials and Energy sectors from the end of quarters with gains of 15% or more. Starting with a look at Financials, that rotation has not necessarily always occurred as the sector has consistently risen over the following three months. Of the ten prior instances, there have only been two quarters, Q3 2009 and Q1 2012, in which Financials were lower by the end of the next quarter. Those were also some of the few times that Financials were lower at the end of the first and second month of the quarter. We would note, though, that the current instance is also the first time since 2009 that there have been back-to-back quarters that the sector has seen gains of 15% or more. Back during that last occurrence (Q3 2009), returns were in fact weaker after that second quarter of large gains.

As for the Energy sector, of the nine prior instances where the sector rallied over 15%, this was the first time with two sequential quarters boasting 15% or larger gains. Additionally, rotation out of Energy stocks has been far more commonplace. As shown in the table below, from the conclusion of those quarters with big gains, the sector has averaged a decline throughout the next quarter. Click here to view Bespoke’s premium membership options for our best research available.
Turn Off, Tune Out
The first quarter of 2021 comes to a close today, and as fast as time seems to fly, it’s been a long one. Take GameStop (GME). It may seem like months and months ago, but it wasn’t until late January that the stock started to go crazy as the ‘Reddit Rebellion’ launched and caused a mad scramble by hedge funds to cover any and all of their short positions. Think about it. In under three months, we’ve seen at least two large funds (Melvin Capital and Archegos), not to mention the collapse of supply chain finance giant Greensill Capital. Sometimes we go an entire year without blowups of this magnitude.
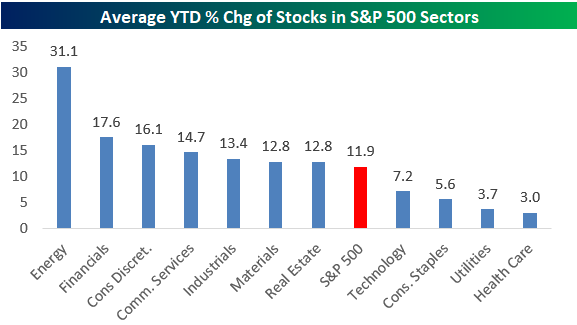
Despite the tumultuous headlines and market volatility along with the frustrating churn in the market lately, US equities are finishing off the quarter well. Stocks in the S&P 500 are up an average of 11.9% so far this year and grouped by sector they’re all averaging gains. Leading the way higher, stocks in the Energy sector stand apart from every other sector with an average gain of over 20%. After Energy, stocks in the Financials and Consumer Discretionary sectors are both up an average of over 15%. On the other side of the chart, sectors underperforming are generally defensive in nature with Health Care and Utilities both averaging YTD gains of less than 5%. One notable underperforming sector given its size is Technology. With an average gain of 7.2% YTD, stocks in the Technology sector are underperforming the broader market by more than 4.5 percentage points.
Given the underperformance of Technology YTD, we can’t help but remember some market ‘certainties’ over the years that never quite came to fruition. Remember after the initial surge off the lows coming out of the Credit Crisis in 2008 and 2009? While Financials were the best performing sector coming off the lows, the rally in the sector ran out of steam and stalled out. All we kept hearing at the time was that ‘the market couldn’t rally without the Financials’, but rally it did. Now, after Technology outperformed during COVID and through last Summer, the sector has stalled out, and we’re hearing the same phrase now as we did back then with the only difference being that Technology has replaced Financials as the sector that the market couldn’t rally without. Since September 2nd though, when we first started to see the ‘Big Shift’ in the market, the S&P 500 has nearly tripled the return of the Technology sector, and despite Tech’s underperformance, the S&P 500 has still managed double-digit percentage gains. When it comes to the old conventional wisdom of the market, investors would be best served by doing the opposite of Timothy Leary by ‘turning off’ and ‘tuning out’ all the noise.
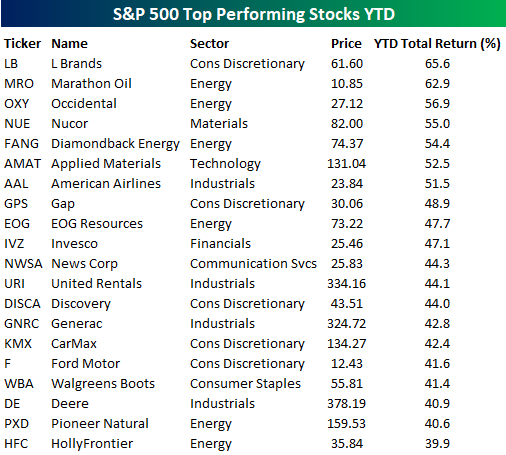
In the tables below, we list the top and bottom twenty performing S&P 500 stocks so far this year. Starting with the winners, L Brands (LB) and Marathon (MRO) are both already up over 60%, while another five stocks have rallied 50%+. With the exception of HollyFrontier (HFC), which is up 39.9%, every other one of the top 20 stocks is up over 40% – in just three months! What’s most notable about this table, though, isn’t what’s on it, but what isn’t. Technology has a larger number of components in the S&P 500 than any other sector, but only one stock from the sector – Applied Materials (AMAT) – made the list of top performers, and only one other besides AMAT (Hewlett Packard Enterprise) made the top 50.
At the other end of the spectrum, there are only 13 stocks in the S&P 500 that are down over 10% YTD, and the 20th worst-performing stock is down less than 9%. And while there was only little representation from the Technology sector on the list of biggest YTD winners above, there’s no shortage on the list of losers with eight of the twenty coming from that sector. It’s only been three months, but stretching back to early last September, the market has gotten along just fine without the help of Technology. Click here to view Bespoke’s premium membership options for our best research available.

B.I.G. Tips – Charts We’re Watching
Bespoke’s Consumer Pulse Report — April 2021
Bespoke’s Consumer Pulse Report is an analysis of a huge consumer survey that we run each month. Our goal with this survey is to track trends across the economic and financial landscape in the US. Using the results from our proprietary monthly survey, we dissect and analyze all of the data and publish the Consumer Pulse Report, which we sell access to on a subscription basis. Sign up for a 30-day free trial to our Bespoke Consumer Pulse subscription service. With a trial, you’ll get coverage of consumer electronics, social media, streaming media, retail, autos, and much more. The report also has numerous proprietary US economic data points that are extremely timely and useful for investors.
We’ve just released our most recent monthly report to Pulse subscribers, and it’s definitely worth the read if you’re curious about the health of the consumer in the current market environment. Start a 30-day free trial for a full breakdown of all of our proprietary Pulse economic indicators.
