Chart of the Day: NASDAQ 100 Stumbling Out the Gate
B.I.G. Tips – Dividends Crushing Tech
Bespoke Consumer Pulse Report — May 2021
Bespoke’s Consumer Pulse Report is an analysis of a huge consumer survey that we run each month. Our goal with this survey is to track trends across the economic and financial landscape in the US. Using the results from our proprietary monthly survey, we dissect and analyze all of the data and publish the Consumer Pulse Report, which we sell access to on a subscription basis. Sign up for a 30-day free trial to our Bespoke Consumer Pulse subscription service. With a trial, you’ll get coverage of consumer electronics, social media, streaming media, retail, autos, and much more. The report also has numerous proprietary US economic data points that are extremely timely and useful for investors.
We’ve just released our most recent monthly report to Pulse subscribers, and it’s definitely worth the read if you’re curious about the health of the consumer in the current market environment. Start a 30-day free trial for a full breakdown of all of our proprietary Pulse economic indicators.

Ethereum Surges and Then Some
For many years, Ethereum may have felt like the ugly ‘step crypto’ to bitcoin, but like the swan in the fairy-tale, it has come into its own lately. Just in the last two weeks its price has surged over 50%. 50% in two weeks! Ethereum’s market cap currently clocks in at about $380 billion (compared to $1 trillion for bitcoin), so the 50% rally in two weeks works out to an increase of around $50 billion. What’s even more amazing about Ethereum’s surge over the last two weeks is that it isn’t even close to a record in terms of two-week gains. As recently as January, Ethereum saw its value more than double in two weeks.
The chart below shows the rolling two-week change of Ethereum over the last three years. During that span, there have actually been five other periods where the two-week change was even higher.

When anything appreciates 50%+ in a two-week span, it only seems logical that it would experience some sort of reversion to the mean. Then again, a two-week rally of 50% seems to defy all logic in the first place, so who knows. The chart below shows the price of ether over the last three years with red dots showing every time the trailing two-week return was greater than 50%. Looking at the chart, there were pullbacks following some of the prior periods, but they were hardly guaranteed. After the most recent surge in January, for example, ether prices barely experienced a hiccup.

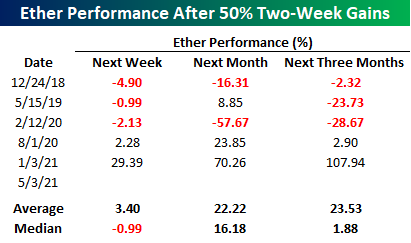
The table below shows the performance of ether over the following week, month, and three months after the first day in each period where ether prices saw a 50% two-week gain. In three of the five prior periods, ether was lower in price a week later for a median decline of 1%. One month later, though, ether rallied three out of five times for a median gain of 16.2%, and three months later, the median gain was 1.88%.
Looking at the results, there is obviously no clear trend in ether prices following similar surges over a two-week span, but the magnitude of the moves in either direction shows just how volatile investing/trading in the crypto-space can be. Click here to view Bespoke’s premium membership options for our best research available.
Bespoke’s Morning Lineup – 5/4/21 – Early Weakness
See what’s driving market performance around the world in today’s Morning Lineup. Bespoke’s Morning Lineup is the best way to start your trading day. Read it now by starting a two-week free trial to Bespoke Premium. CLICK HERE to learn more and start your free trial.
“As society becomes more and more complex, cheating will in many ways become progressively easier and easier to do and harder to police or even understand.” – Vitalik Buterin
Equity futures were mixed up until about an hour ago with the DJIA indicated to open higher while the Nasdaq was lower. Shortly before 8 AM Eastern, we saw a leg lower with the Nasdaq leading the way and now down closer to 1%. Oddly enough, while one might expect the weakness, especially in the Nasdaq, to coincide with a tick higher in rates, yields on the 10-year actually dropped below 1.6% as futures moved lower. In the grand scheme of things, this isn’t a major move, but it does mark a continuation of the trend of weaker breadth we have seen in the Nasdaq lately that we discussed in last week’s Bespoke Report.
Read today’s Morning Lineup for a recap of all the major market news and events including the biggest overnight events, some key earnings reports, economic data from around the world, as well as the latest US and international COVID trends including our vaccination trackers (which continue to show a significant deceleration in vaccine uptake), and much more.

Moving from the equity market world to the crypto world, just when the general public was finally becoming familiar and comfortable with bitcoin, ethereum has taken the spotlight. While bitcoin has essentially moved sideways over the last 2+ months, the price of ether has practically doubled. Following the divergent performances, the relative strength of ether versus bitcoin has surged in the last several weeks to the point where ether is actually outperforming bitcoin over the last three years.

Looking at it another way, the ratio of bitcoin to gold has plummetted. Back in September 2019, the ratio of bitcoin to gold peaked out at 61.1. Then around the March 2020 equity market lows, the ratio had shrunk to just under 50. Through yesterday, the ratio has now been cut by two-thirds since March 2020 to 17.5 – the lowest level since the summer of 2018.

Compared to gold, ether’s value has surged. At the start of the year, ether was worth less than a half-ounce of gold. Yesterday, it was worth nearly two ounces of gold! Talk about a rally.

Daily Sector Snapshot — 5/3/21
Restaurants Reopening
As vaccines continue to roll out, case counts drop, and restrictions like capacity requirements are taken off the table, people are returning to bars and restaurants. In the commentary section of today’s ISM Manufacturing report, the highlighted comment from the Food, Beverage, and Tobacco Products industry noted that “Business is picking up as restaurants open.” As shown below, data from OpenTable on the seven-day moving average in the percent change in seated US diners now versus 2019 backs that up. The series showed a steep drop in mid-April that has since recovered. Currently, seated diners are roughly 19% below 2019 levels and are re-approaching the post-pandemic high from April 10th which was just over 2 percentage points above current levels. One caveat with these numbers is that restaurants are increasingly requiring diners to make reservations, so while the number of diners may not be quite as strong as it looks, the trend higher is definitely real.

While the general business environment has improved for food, beverage, restaurants, and other related industries, the stocks of these companies have been a bit mixed as we noted in our earlier B.I.G. Tips report. For example, the Food Products industry has seen a breakout over the past couple of months while the Hotels, Restaurants, & Leisure industry has been trading around the top of its long-term uptrend. Meanwhile, the Food & Staples Retailing and the Beverage industries have been more or less treading water.
In the charts below, we show some interesting charts of the individual S&P 500 stocks within these industries. While the broader industry has been around the top of its uptrend channel, some restaurant stocks such as Darden (DRI), Chipotle Mexican Grill (CMG), and Starbucks (SBUX) have likewise been in mostly steady uptrends over the past year but stalled out more recently while holding support at their 50-DMAs. While the longer-term trends are not the same, other food and beverage-related stocks like Brown-Forman (BF/B) and Conagra Brands (CAG) have also been bouncing off of support around their 50 or 200-DMAs. While more elevated above their moving averages, other stocks that have surged recently, and as a result, have broken out include Hershey (HSY) and Molson Coors (TAP). Meanwhile, PepsiCo (PEP) and Constellation Brands (STZ) are also working towards breakouts of their own; STZ at the moment is the closer of the two in doing so while PEP is looking to complete a rough cup and handle pattern that has developed over the past few months. Click here to view Bespoke’s premium membership options for our best research available.

Pace of Background Checks Slows
The latest update from the FBI on the number of gun background checks in the United States was released earlier and showed the largest month-over-month decline on record. While March saw a record 4.691 million background checks, April saw ‘just’ 3.514 million. That decline of 1.2 million was easily the largest on record surpassing the prior record decline of 875K from ‘way back’ in February of this year. Also worth pointing out is the fact that March’s increase of 1.25 million background checks was the largest increase on record. In other words, the pace of background checks is still at historically high levels. In fact, even though there have been seven other months with a higher number of background checks, none of those higher levels occurred prior to March 2020.

On a y/y basis, background checks are up 20.7% from the same month last April, and that represents a record fourteen straight months that they’ve increased 20%+ on a y/y basis. 20% y/y is strong enough, but once you start compounding at that rate, it really adds up! Not only that, but the average y/y change during those fourteen months has been 38.3%.

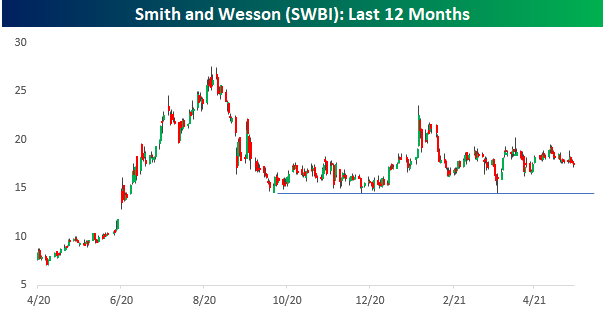
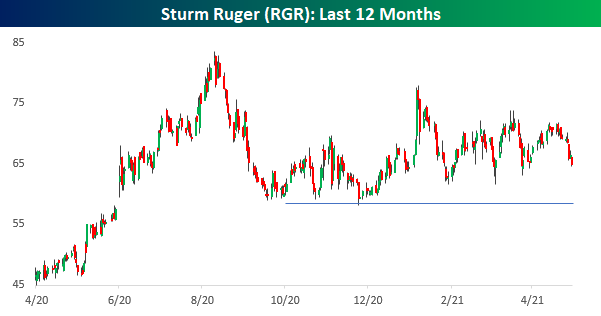
On the one hand, background checks are compounding at 20% per year, while at the same time, total checks saw the largest m/m decline on record. With those conflicting signals, investors can’t seem to make up their minds over what to do with the stocks of the pure-play gun makers. The charts below show the performance of Smith and Wesson (SWBI) and Sturm Ruger (RGR) over the last year. Both stocks saw impressive gains last summer during the height of civil unrest, but as the violence subsided, so too did their stocks. After erasing roughly half of their summer gains in the fall of last year, both stocks have essentially been stuck in a trading range for the last eight months. In the case of both stocks, they are currently trading at the same level now as they were last September. Click here to view Bespoke’s premium membership options for our best research available.
Bespoke Market Calendar — May 2021
Please click the image below to view our May 2021 market calendar. This calendar includes the S&P 500’s average percentage change and average intraday chart pattern for each trading day during the upcoming month. It also includes market holidays and options expiration dates plus the dates of key economic indicator releases. Start a two-week free trial to one of Bespoke’s three research levels.
