Bespoke’s Weekly Sector Snapshot — 4/8/21
The Bespoke 50 Top Growth Stocks — 4/8/21
Every Thursday, Bespoke publishes its “Bespoke 50” list of top growth stocks in the Russell 3,000. Our “Bespoke 50” list is made up of the 50 stocks that fit a proprietary growth screen that we created a number of years ago. Since inception in early 2012, the “Bespoke 50” is up 461.3% excluding dividends, commissions, or fees. Over the same period, the Russell 3,000’s total return has been +260.8%. Always remember, though, that past performance is no guarantee of future returns. (Please read below for more info.) To view our “Bespoke 50” list of top growth stocks, please start a two-week trial to either Bespoke Premium or Bespoke Institutional.
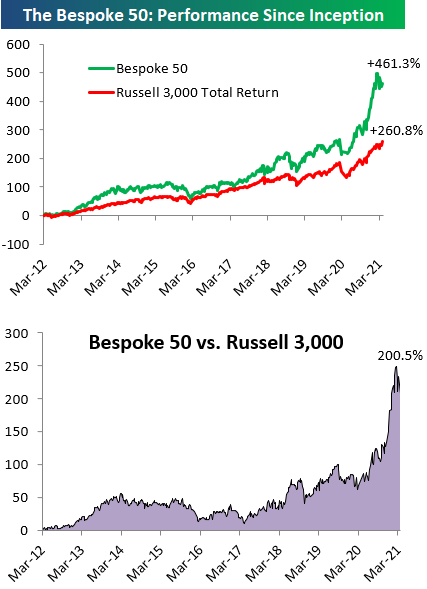
The Bespoke 50 performance chart shown does not represent actual investment results. The Bespoke 50 is updated weekly on Thursday. Performance is based on equally weighting each of the 50 stocks (2% each) and is calculated using each stock’s opening price as of Friday morning each week. Entry prices and exit prices used for stocks that are added or removed from the Bespoke 50 are based on Friday’s opening price. Any potential commissions, fees, or dividends are not included in the performance calculation. Performance tracking for the Bespoke 50 and the Russell 3,000 total return index begins on March 5th, 2012 when the Bespoke 50 was first published. Past performance is not a guarantee of future results. The Bespoke 50 is meant to be an idea generator for investors and not a recommendation to buy or sell any specific securities. It is not personalized advice because it in no way takes into account an investor’s individual needs. As always, investors should conduct their own research when buying or selling individual securities.
Sentiment Running Hot
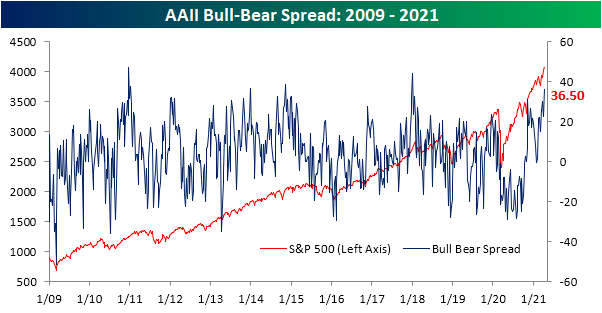
With the major US indices pressing to new record highs, sentiment has picked up considerably in the past week. Bullish sentiment measured in the AAII weekly sentiment survey came in the top 5% of all prior weekly readings after rising by 11.1 percentage points to 56.9%. That makes for the largest one-week increase since the week of November 12th when bullish sentiment leaped 17.88 percentage points to 55.84%. This week also surpassed that November reading to make for the highest level of bullish sentiment since the first week of 2018 when 59.75% of respondents reported as bullish.

Bearish sentiment was already low headed into this week, but the reading fell another 2.8 percentage points to 20.4%. That is marginally lower than the reading of 20.6% from two weeks ago making for the lowest level of bearish sentiment since April 2019.

The big jump in bullish sentiment borrowed more heavily from the neutral camp. The percentage of respondents reporting as neutral collapsed 8.3 percentage points to 22.7%. Similar to bullish sentiment, that was the biggest single-week decline since November 12th and the lowest reading since that same week.

These moves mean sentiment now largely favors the bullish camp. In fact, the bull-bear spread rose to 36.5 which is the highest level since the first week of 2018.
To see what these types of sentiment readings mean for equity market returns, make sure to log in. If you aren’t currently a client, sign up for a free trial to one of Bespoke’s research offerings to view the rest of this report.
Which of the Bonds is Unlike the Others
When it comes to the fixed income space, 2021 has been a rough year. Just about every area of the sector you look at, YTD returns have been negative. Below is a snapshot of a custom portfolio of fixed income-related ETFs from our Trend Analyzer. Two things in the snapshot stand out. First, the only ETF in the group above its 50-DMA is the High Yield Bond ETF (HYG). Not only is it above its 50-DMA, but it’s also overbought! Given the recent strength in HYG, it is also the only ETF in the group that is up YTD with a gain of just under 1%. While short-term US Treasury related ETFs are down less than 1%, the TIPS ETF is down over 1% (TIP), total bond market ETFs are down over 3% (AGG and BND), the emerging market fixed income ETF is down close to 5%, while longer-term US Treasury ETFs are down over 10%!

Also noteworthy about the high yield bond market is the fact that the B of A High Yield Master Index just made a new all-time high on a total return basis, taking out its mid-February high. Apropos to its name, high yield has been a high point of the fixed income sector. Click here to view Bespoke’s premium membership options for our best research available.

Mixed Claims Picture Based on Program
Initial jobless claims were expected to fall to 680K this week, which would have been just 22K above the pandemic low set two weeks ago. Instead, claims ticked higher for a second week in a row to 744K. Additionally, last week’s print of 719K was revised higher to 728K.
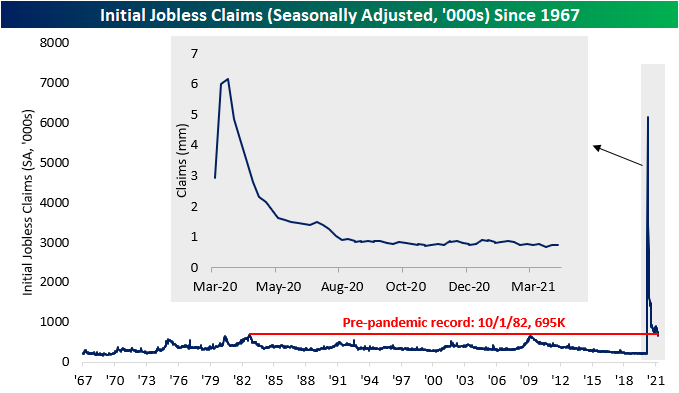
On a non-seasonally adjusted basis, the current week of the year (14th week) typically sees a higher reading in jobless claims. In fact, since 1967 when the data begins, the current week of the year has seen a week over week increase in initial claims 88.9% of the time. Of all weeks of the year, it is the third most consistent in experiencing higher claims. Given this seasonality, unadjusted claims rose 18.2K from last week. Although higher sequentially, that is still at the lower end of the past year’s range. Pandemic Unemployment Assistance (PUA) made up for that weakness, though. PUA claims fell by over 85K to a new pandemic low of 151.75K. That meant on a combined basis (regular state claims plus PUA claims), initial jobless claims were just slightly above the past year’s low from two weeks ago.

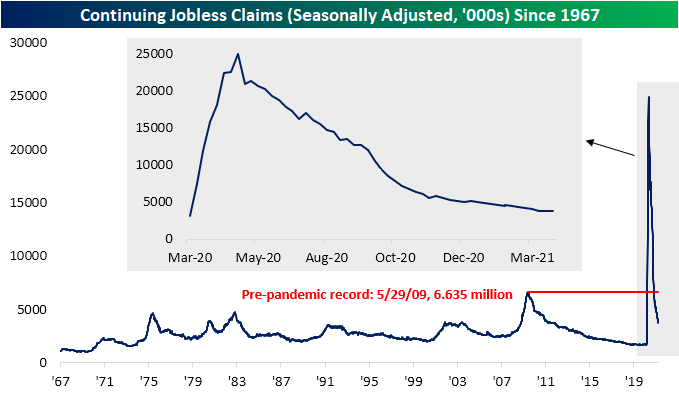
Continuing claims were also better this week falling to a new low of 3.734 million. While that marked the twelfth week in a row that claims have fallen and any new low is certainly welcome, we would note that the pace of improvement has decelerated. As shown below, continuing claims have been flattening out recently with this week’s 16K decline in seasonally adjusted continuing claims a prime example. That 16K improvement actually marked the smallest decline of the past year.
The most recent data factoring in all other unemployment programs is through the week of March 19th. Total claims were somewhat flat for that week with only a small decline from 18.249 million to 18.196 million. Big declines in regular state claims (-134.5K) and the Extended Benefits program (-230.78K) were largely offset by sizeable increases in PUA claims (+203.29K) and Pandemic Emergency Unemployment Compensation (+117.11K). In other words, the picture can be painted as improving or more of the same depending upon which program you are looking at.
In the past, we have noted the changing composition of continuing jobless claims with extension-based programs like Extended Benefits and PEUC taking up an increased share of total claims. For the most recent week, that picture is a bit mixed up. While the 230.78K decline for the Extended Benefits program meant these claims fell to the lowest since early December at 787K, PEUC claims (which is also a larger program with 5.6 million claims) were higher and in the middle of the past several weeks’ range. Together, these two extension programs’ share of total claims has peaked for the time being but still account for over 35% of total continuing claims. Click here to view Bespoke’s premium membership options for our best research available.

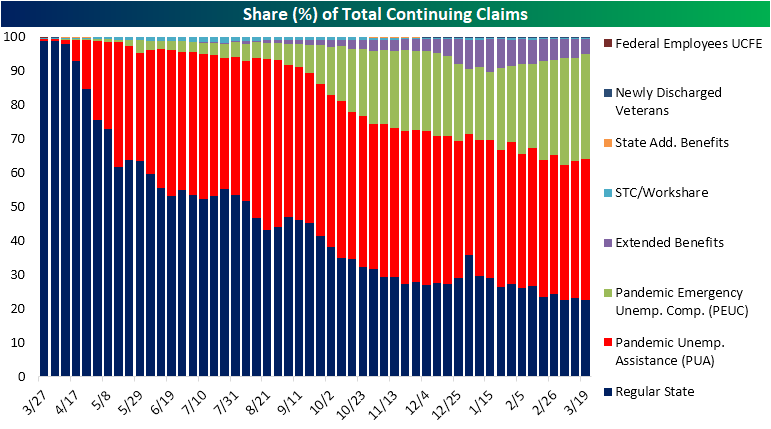
Chart of the Day: New Look For Newell (NWL)
Bespoke’s Morning Lineup – 4/8/21 – Triumph of the Optimists
See what’s driving market performance around the world in today’s Morning Lineup. Bespoke’s Morning Lineup is the best way to start your trading day. Read it now by starting a two-week free trial to Bespoke Premium. CLICK HERE to learn more and start your free trial.
“I am so far from being a pessimist…on the contrary, in spite of my scars, I am tickled to death at life.” – Eugene O’Neill
If you’re looking at the futures for the S&P 500 and Dow, it’s looking like a flattish to modestly positive start to the trading day, but looking over at futures for the Nasdaq shows an entirely different story as that index is indicated to open up by nearly 1%. Driving the gains in the Nasdaq is the mega caps of Alphabet, Apple, Facebook, Microsoft, and Tesla which are all trading up by 0.75% or more in the pre-market. Given recent moves in the fixed income market, the recent strength of the mega-caps makes sense. Think about it, since the start of April we have seen some extremely strong to even historic levels of economic data points, but the yield on the 10-year US Treasury is actually down MTD. Strong data and lower rates? The mega-caps will take it!
Read today’s Morning Lineup for a recap of all the major market news and events including Japanese purchases of treasuries, German factory orders, US and international COVID trends as well as our series of charts tracking vaccinations, and much more.

Another area of the market where we’re seeing some unwelcome strength is in sentiment. This morning’s release of bullish sentiment from the American Association of Individual Investors (AAII) showed that bullish sentiment surged by the most since November to 56.90%. The last time this reading was higher was way back in early 2018.

Daily Sector Snapshot — 4/7/21
Chart of the Day: Earnings Tide Turning?
B.I.G. Tips – Financials Ready to Kick Off Earnings Season
Next week we’ll officially kick off the Q1 earnings season as the major banks all start to report results. As shown in the chart to the right, the pace of reports will start off slow but steadily pick up steam as the days go on. Just 23 companies are scheduled to report next week, but that number will more than triple the next week and then more than double again the week of 4/26 which is the peak week for reports. There will be one more busy week of reports after that before things start to peter out after the first week of May.

What can we expect to see from the market as earnings season progresses? Make sure to check our quarterly preview of the upcoming earnings season for a look at how analyst sentiment tends to impact market performance during earnings season. For anyone with more than a passing interest in what to expect from the market during earnings season, make sure you check out this report. To see it, sign up for a monthly Bespoke Premium membership now!