Revisions Bring The Streak Back to Life
Last week saw an impressive reading for jobless claims falling to 576K. While that was revised slightly higher to 586K this week—which would still be well below the previous low for the pandemic—today’s release saw further improvements with initial claims dropping another 39K from that revised level to 547K. That brings the total decline over the past two weeks to just under 200K; the largest since the first week of August when claims first fell back below one million.

On a non-seasonally adjusted basis claims likewise continue to fall which is normal given the time of year. The current week of the year (week number 16) has only seen unadjusted claims rise week over week 13% of the time going back to 1967 when the data begins. In other words, the improvement in claims comes alongside seasonal tailwinds as non-seasonally adjusted initial jobless claims fell to 566.5K this week from 623K last week. The picture for Pandemic Unemployment Assitance was not as positive as the program experienced a small uptick from 131.7K to 133.3K. Nonetheless, that is the second week in a row with a very low count in claims for this program.

Continuing jobless claims had been on an impressive streak of 12 straight weeks of declines, but that appeared to end last week after rising to 3.731 million. Fast forward to today’s release and that reading was revised down significantly by 23K to 3.708K. Given that was below the prior week’s 3.717 million reading and the most recent reading fell further to 3.674 million, the streak of consecutive week-over-week declines has been brought back to life, extending to 14 weeks long. As shown in the second chart below, that makes for the longest streak of consecutive declines on record. Overall, the continuing claims picture continues to consistently improve as continuing claims are well below the pre-pandemic record from the last recession. Granted, current levels are still historically elevated around levels of past highs like those in the early 1990s and 2000s.


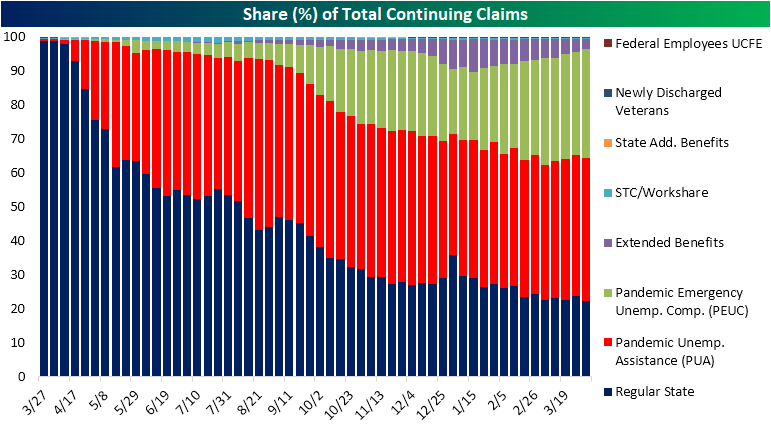
When factoring in all programs, the most recent data is for the first week of April. Based on the latest results, we saw an uptick in total continuing claims across all programs rising just under 500K to 17.4 million. While regular state claims and the Extended Benefits program both saw declines of more than 100K, they were offset by 265.2K and 447.7K respective increases in PUA claims and Pandemic Emergency Unemployment Compensation (PEUC) claims. Those increases bring these programs’ claim counts back up to similar levels as a month ago. Meanwhile, Extended Benefits claims are at their lowest level since early October, and regular state claims are at the lowest of the pandemic.
As for the composition of claims, those moves meant a significant share (35%) of total claims still come from extension programs like PEUC and Extended Benefits. While that is below the highs from last month on a combined basis, breaking this down further, the PEUC program’s share of total claims reached 32.2% in the most recent week’s data; a new high for the pandemic. Meanwhile, the Extended Benefits program’s share fell to the lowest level since October. There is a similar dynamic for PUA and regular state claims with the former accounting for a growing share of total claims and the latter accounting for the smallest share of the pandemic. Click here to view Bespoke’s premium membership options for our best research available.

Ether Gets On the Field
Ever since ‘crypto’ entered the mainstream, bitcoin has been the superstar. Sure, doge has gotten its 15 minutes, but at least nine out of ten times, if you ask someone about crypto, the first asset they are going to mention is bitcoin. The next most popular crypto asset has pretty much always been ethereum, but it has always taken a backseat to bitcoin. Even today, while bitcoin has a total market value of just over one trillion dollars, the total value of ether out there is just under $300 billion.
While ethereum is less than a third the size of bitcoin, in recent days it has been holding up very well given the pullback in bitcoin. The chart below shows the performance of both crypto-currencies over the last six months. While they’ve followed relatively similar paths, you’ll notice that despite bitcoin’s 15%+ pullback, ether has traded to record highs.

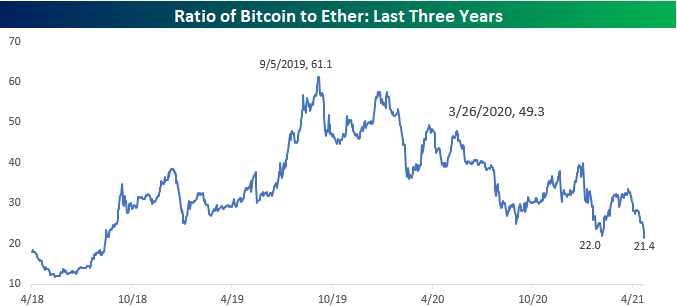
Another way to put the recent performance of ether versus bitcoin into perspective is to compare the ratio of the two over time. In the chart below, we show the ratio of bitcoin versus ether going back to early 2018. A high ratio indicates that bitcoin is outperforming ether and vice versa. Back in late 2018, the ratio between the two peaked out at more than 60 ether per bitcoin, but it has been trending lower ever since. In fact, as of today, one bitcoin is worth just over 21 ether which is the lowest ratio since August 2018. Ether may have been nothing more than a single-A player relative to bitcoin a year and a half ago, but it has quickly worked its way up to the system and earned itself a spot in the dugout next to bitcoin. Click here to view Bespoke’s premium membership options for our best research available.
B.I.G. Tips – Charts We’re Watching
Bespoke’s Morning Lineup – 4/22/21 – Strong Earnings, Market Yawns
See what’s driving market performance around the world in today’s Morning Lineup. Bespoke’s Morning Lineup is the best way to start your trading day. Read it now by starting a two-week free trial to Bespoke Premium. CLICK HERE to learn more and start your free trial.
“Be brutally honest about the short term and optimistic and confident about the long term.” – Reed Hastings
It’s been another strong overnight session in terms of earnings results, but as has been the case recently, the market isn’t very impressed. Futures are modestly negative to flat, even after jobless claims came in well below forecasts and at their lowest levels since the pandemic. The ECB left its policy position in place, but we’ll be looking for further details in the press conference coming up shortly.
Read today’s Morning Lineup for a recap of all the major market news and events including the biggest overnight events, some key earnings reports, economic data from around the world, as well as the latest US and international COVID trends including our vaccination trackers, and much more.

Yesterday was a strong day for the equity market, and while the Nasdaq 100 are both near all-time highs, the Russell 2000 continues to struggle. Even after yesterday’s rally, IWM remains below its 50-day moving average. On the one hand, until it can break back above its 50-DMA, the burden of proof is on the bulls, but if it can break above that level, you could argue that much of the froth in small caps has been worked off, so expectations are relatively low.

Daily Sector Snapshot — 4/21/21
Emerging Markets Mixed on 52-Week Highs
The S&P 500 is headed back up towards record highs today, but the index’s pullback earlier in the week was shared with other equity markets around the world. In the table below, we show the ETFs tracking the stock markets of the 23 countries in our Global Macro Dashboard. Last week most of these were overbought with some at extremely overbought levels of more than 2 standard deviations above their 50-DMAs. Performance over the past week has been mixed but broadly speaking these countries are now lower within their respective trading ranges. One notable exception has been Taiwan (EWT) which has been the best performer rising to 52-week highs and moving into extreme overbought territory. Mexico is also at a 52-week high today.
When it comes to developed versus emerging market countries, though, these are two outliers with their cohorts mostly on the other end of the spectrum. On average, EM countries are underperforming on a year-to-date basis and the only countries in the red in 2021 are EM names. As a result, these also are generally much further from their 52-week highs. For example, Malaysia (EWM), Brazil (EWZ), India (INDA), and China (MCHI) are all the furthest (at least 5% below) from their 52-week highs. Granted in the past week EM has outperformed on average with the exception of INDA which has been the worst performer of the 23 countries as COVID cases soar in that country. Meanwhile, developed market countries are 34 bps lower on average but generally closer to their highs and more overbought.

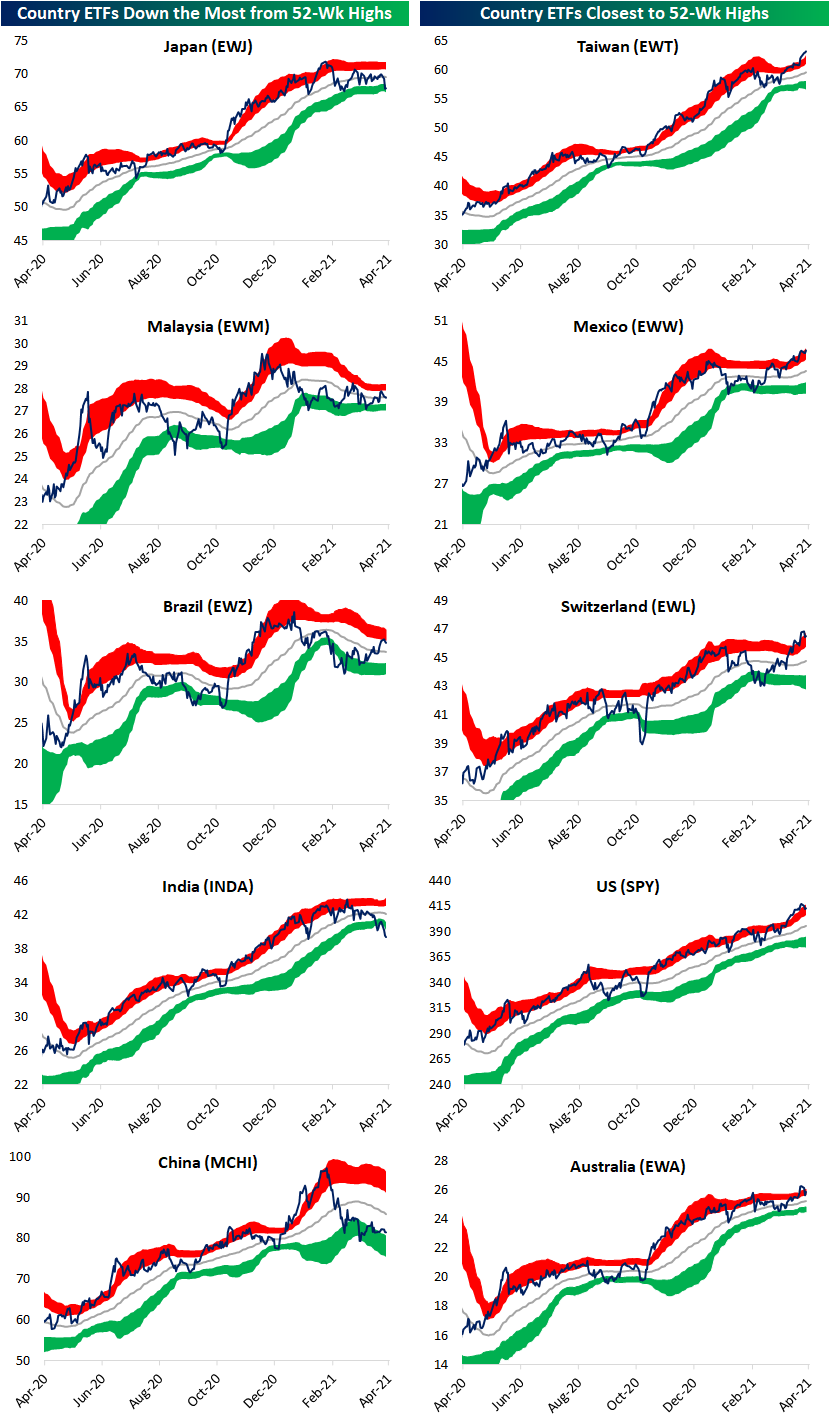
In the charts below we show the five countries that are furthest from and closest to their 52-week highs. As we noted in today’s Morning Lineup, Japanese equities (EWJ) last peaked in mid-February but have been trending lower ever since and have taken a sharp leg lower in recent days. That leaves EWJ right at the low end of the past few months’ range. That is the only developed market country of those the furthest below their 50-DMAs. Of the other countries with the furthest to go until they reach their 52-week highs, only INDA is also around critical support levels after a significant short-term move lower recently. EWM, EWZ, and MCHI on the other hand are further off their lows. EWZ has even been trending higher over the past month.
As previously mentioned, Taiwan (EWT) and Mexico (EWW) are both setting new 52-week highs today. There are a handful of other countries that are within 2% of doing the same but Switzerland (EWL), the US (SPY), and Australia (EWA) are the closest. Click here to view Bespoke’s premium membership options for our best research available.
Altria (MO) Gets it Butt Kicked
It hasn’t been a particularly good week for a lot of stocks to this point, but Altria (MO) has been especially hard hit following news that the Biden Administration may issue restrictions on the amount of nicotine that can be contained in cigarettes. While the stock is off its lows from earlier in the week, it’s still down 9%. Meanwhile, Philip Morris International (PM), which has no exposure to US tobacco sales and regulation, has risen more than 2% so far this week.
The snapshot of the two stocks from our Trend Analyzer shows the divergent paths of each stock following Monday’s news. Through Tuesday, while MO dropped below its 50-DMA, PM moved from merely overbought to ‘extreme’ overbought levels.

Over time the stocks of both MO and PM have trended to track each other pretty closely, especially over the last five years. Therefore, given the short-term disparity in performance between the two stocks, does this week’s sell-off in MO provide an attractive risk/reward trade-off relative to PM?
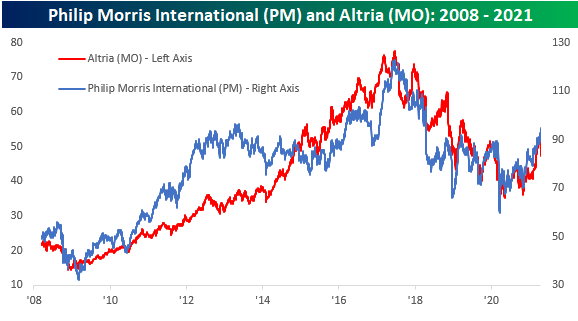
At first glance, that would seem to be the case, but some perspective is on order. The chart below shows the 50-day performance spread between MO relative to PM going back to 2008. What’s important to keep in mind is that this week’s move has only narrowed what was previously an extreme performance gap where MO was outperforming PM and MO is still outperforming PM over the last 50 trading days. In fact, back in late March when the performance gap between the two was over 15 percentage points, it was the fifth widest spread since Philip Morris split up its international and domestic units in 2008. As bad as a week as its been for MO relative to PM over the last few days, the last few weeks had been just as painful for PM relative to MO. Click here to view Bespoke’s premium membership options for our best research available.

Chart of the Day: More Earnings Weakness
Bespoke’s Morning Lineup – 4/21/21 – Three in a Row?
See what’s driving market performance around the world in today’s Morning Lineup. Bespoke’s Morning Lineup is the best way to start your trading day. Read it now by starting a two-week free trial to Bespoke Premium. CLICK HERE to learn more and start your free trial.
“The desire to perform all the time is usually a barrier to performing over time.” – Robert Olstein
Well, it’s just not looking like it’s going to be a week for the bulls as US stocks are poised for their third straight day of declines in what would be the longest losing streak since early March. There’s still practically no economic data to speak of this week as the only report today was mortgage applications. Don’t worry, though, the pace of reports will really pick up tomorrow, and earnings season has already kicked into gear.
So far this week, the trend of reports has been positive as more than 85% of S&P 500 companies reporting have topped EPS forecasts, and more than three-quarters have topped revenue estimates. Those are strong results, although stock price reactions have been somewhat uninspiring with stocks reporting on Monday and Tuesday morning falling an average of 0.79% in reaction to their reports.
Read today’s Morning Lineup for a recap of all the major market news and events including a recap of the biggest overnight events including some key earnings reports, economic data from around the world, some surprising political polls in Germany, as well as the latest US and international COVID trends including our vaccination trackers, and much more.
Stocks haven’t only been down in the US this week. Japan’s Nikkei fell 2% for the second straight day overnight as a new COVID wave there continues to accelerate. At current levels, the Nikkei is trading right at levels that have acted as support multiple times in the last couple of months as the index continues to trade in a somewhat narrow range.

From the perspective of a US investor, the chart below shows the Nikkei’s performance in dollar-adjusted terms. From this view, the chart doesn’t look all that different as the Nikkei remains right at the bottom of its recent range, although the drawdown from its February high has been a bit steeper.
