Russell 3000 50/50 Club
If the performance of GameStop (GME) this year has shown us anything, it is that it’s been a crazy year for the stock market.

GME is not the only example either. Within the Russell 3000, there are actually 100 stocks that have dropped 50% or more from their 52-week highs but are still up over 50% from their respective 52-week lows. That’s quite a rollercoaster!
The table below shows the 19 stocks in the Russell 3000 that have market caps in excess of $4 billion that fit the criteria mentioned above. While some of these stocks are biotech names that you may not have heard of, many of them are familiar sounding and even household names. Topping the list is Zoom Video (ZM). Despite falling more than 50% from its 52-week high, the stock is still up over 80% from its 52-week low and has a market cap of just under $85 billion. Right behind ZM, Peloton (PTON) is still up over 100% despite falling just over 50%. Next on the list are two Archegos stocks – ViacomCBS (CBS) and Discovery (DISCA). Other names you’ve likely heard of include Novavax (NVAX), GME, Plug Power (PLUG), Microstrategy (MSTR), AMC, and Stitch Fix (SFIX). Click here to view Bespoke’s premium membership options for our best analysis available.

Bad Starts to May for the Nasdaq and Russell 2000
One week ago in our Chart of the Day, we noted how the Nasdaq 100 was having a rough start to May. One week later that has continued to be the case as the declines keep coming. Looking at the Nasdaq Composite (which has a longer history than the Nasdaq 100) the index is down again today as of this writing which leaves it down nearly 5% month-to-date. From a seasonal perspective, early May is not exactly the best time of year, but even with that in mind, since the index began in 1971, that ranks as the second-worst performance through the first seven trading days of May on record. Only 2000 saw weaker performance in the same time span, but it was much larger at nearly twice the magnitude of this month’s drop. Additionally, while the decline MTD is steep, 2000 saw a much larger decline that was an entire 4.5 percentage points larger than this year.
So far this month, other major US indices are also lower with the exception of the Dow which is still up 0.72% MTD even after the past couple of days of declines. That is the best start to any May since 2018 and is roughly twice as strong as the average performance through the first seven trading days of all Mays since 1971. The S&P 500, on the other hand, is lower month to date but that 1.33% decline does not really stand out compared to past years as it does for the Nasdaq or the small-cap Russell 2000. The Russell 2000 more closely resembles the Nasdaq. It is on pace for a 3.64% decline MTD which like the Nasdaq is the worst start to the month of May since 2000. The only other years that come close to as weak in terms of performance were declines of over 3% in both 2012 and 1979. Click here to view Bespoke’s premium membership options for our best research available.

Chart of the Day: Decile Analysis Since 2/12
April 2021 Headlines
Bespoke’s Morning Lineup – 5/11/21 – Not Turnaround Tuesday Yet
See what’s driving market performance around the world in today’s Morning Lineup. Bespoke’s Morning Lineup is the best way to start your trading day. Read it now by starting a two-week free trial to Bespoke Premium. CLICK HERE to learn more and start your free trial.
“Earnings don’t move the overall market, it’s the Federal Reserve Board… focus on the central banks, and focus on the movement of liquidity… most people in the market are looking for earnings and conventional measures. It’s liquidity that moves markets.” – Stanley Druckenmiller, 2015.
The prospects for a turnaround Tuesday aren’t looking particularly positive this morning. What was already a weak picture in equity futures has turned even worse as hedge fund manager Stan Druckenmiller just appeared on CNBC with a rather dour outlook on the future prospects of the economy and markets following a just published WSJ op-ed as well. While his media appearances are typically more bearish than bullish, some of his points are certainly valid and have clearly caused a more cautious mood heading into the opening bell. While equity futures are sharply lower, we’ve seen little movement in treasuries or gold. Crude oil and bitcoin are both moderately lower.
Read today’s Morning Lineup for a recap of all the major market news and events including a recap of overnight earnings reports and economic data, including updates on the ZEW economic surveys and NFIB sentiment, as well as the latest US and international COVID trends including our vaccination trackers, and much more.

With today’s weakness in futures, the Nasdaq looks to continue leading to the downside, and the technical picture looks weaker this morning than it did heading into the week. After failing to take out its high from earlier in the year in late April, the Nasdaq has been under heavy selling pressure ever since. In yesterday’s sell-off to start the week, not only did the Nasdaq break below its 50-DMA, but it also broke its short-term uptrend from the March lows.

Daily Sector Snapshot — 5/10/21
China (MCHI) Following in the Footsteps of ARK Innovation (ARKK)
On Friday and earlier today, we noted how the ARK Innovation ETF (ARKK) has been making a move below its 200-DMA and support that had been in place over the past few months thanks to a 5.23% decline in Monday’s session. But as we also noted in an earlier tweet, there is another ETF whose chart draws a lot of parallels to ARKK: the iShares MSCI China ETF (MCHI).
Just like ARKK, MCHI ripped higher earlier this year before plummeting throughout the spring. After falling another 3% today, MCHI is also now trading below its 200-DMA for one of the first times of the past year. That drop also marked a break of support from levels earlier this spring. MCHI is now on the cusp of meeting the definition of a bear market having fallen 19.68% from its 52-week high. ARKK is even further below having dropped 35%. Click here to view Bespoke’s premium membership options for our best research available.
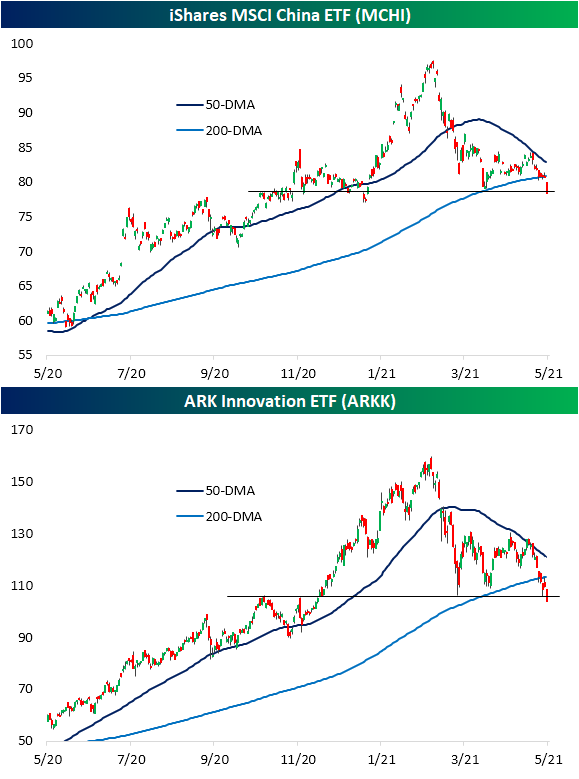
Chart of the Day: Financials Sub In For Technology
Sell In May In Full Effect
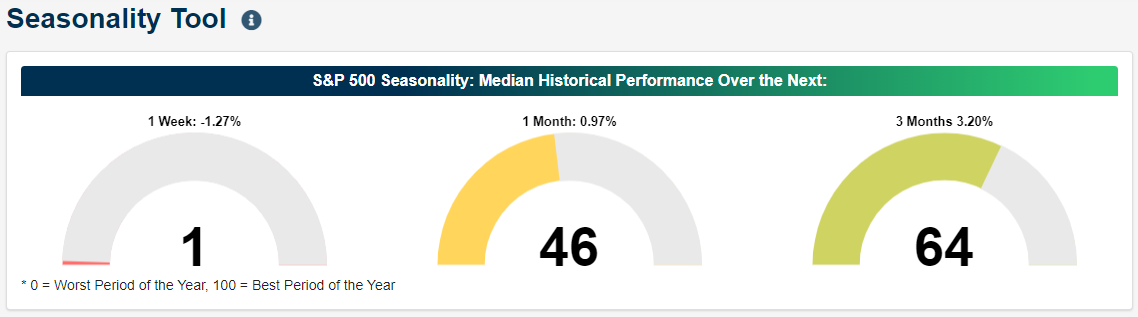
If there is any week this month that the “Sell in May” saying would apply, it would be the current one. As shown in the screenshot of our Seasonality Tool below, the S&P 500’s median performance one week from the close on May 10th over the past ten years has been a 1.27% decline. That ranks in the bottom 1% of all days of the year. The only two days with worse median weekly performance over the past ten years have been March 16th’s 1.32% loss and a 1.47% loss from the week after January 21st. Although seasonality is not on the side of the S&P 500 in the near term, performance has typically been stronger one and three months out with median gains of 0.97% and 3.2%, respectively. That is not to say those are notably strong readings, though, as those median gains are middling versus other periods of the year.
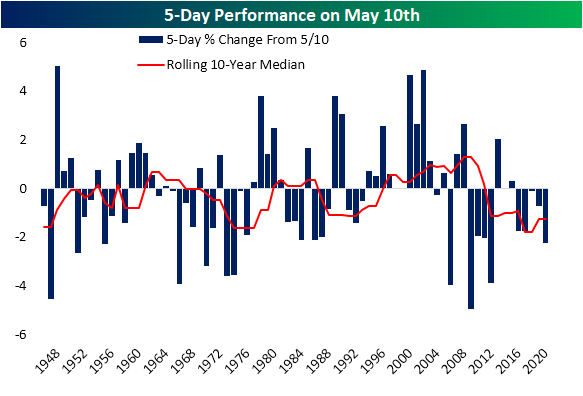
Giving some more color to this, in the chart below, we show the 5-day performance of the S&P 500 from May 10th (or the nearest prior close in the case of years that May 10th did not fall on a trading day) for all the post-WWII years. Again, the S&P 500 has been seasonally weak over the past decade with a median decline of 1.27%. That seasonal weakness also extends slightly further back for the majority of the post-Great Recession era as only 2013 and 2015 saw gains for the time period in question since 2009.
Looking further back, that seasonal weakness has not necessarily been consistent though. In 2009 and 2008, the rolling 10-year median performance sat at a polar opposite 1.3%. Looking back even further, that rolling median performance has frequently fluctuated between positive and negative performance, and is currently just bouncing off what were the most extremely negative levels in the post-WWII period. Even after all the fluctuations, though, the median for all years since 1946 is still a negative 11 bps. In other words, while the past decade or so has been marked by seasonal weakness for the current week of the year, it has historically been far from a sure-fire bet, and as always, we would caution against purely investing based on seasonality. Click here to view Bespoke’s premium membership options for our best research available.
Bespoke CNBC Appearance (5/10/21)
Bespoke co-founder Paul Hickey appeared on CNBC’s Squawk Box to discuss the Friday jobs report and what it means for the market going forward. To view the segment, click on the image below. Click here to view Bespoke’s premium membership options for our best research available.
