Daily Sector Snapshot — 5/12/21
Gas Prices Put Into Perspective
The Colonial Pipeline ransomware attack resulted in a shutdown of a major artery on the East Coast. While the pipeline is partially back online and anticipated to once again be fully operational later this week, the temporary supply outage has resulted in headlines of long lines and some gas stations even totally running out of product to sell, and that has only started to feed on itself causing more hoarding. As a result, the national average for a gallon of gasoline according to AAA crossed back above $3 this week for the first time since October 2014.

According to AAA, just in the past day, the average price of a gallon of regular unleaded gasoline has risen 2.3 cents and over the past week, it is up 8.1 cents. At an annualized pace, the price of a gallon of regular gasoline is up 281.24% in the past day and 143.9% over the past week. Higher grades of gasoline and diesel have risen by a lesser amount but have likewise seen significant appreciation.

At face value, those readings may look alarming, but from a historical standpoint, we’ve seen far larger. Looking again at the annualized weekly change for regular gasoline in the chart below, the current reading actually comes up just shy of the top decile of all readings since 2004, and there were even higher readings as recently as this past February and March. Even accounting for seasonality (gray shaded regions in the chart highlight every month of May), prices tend to move higher this time of year, and there have been multiple times in the past that gasoline prices have risen at as fast of a clip as now in the month of May. For example, last year was one instance in addition to 2015 and 2016. So, from a national perspective, this week’s uptick in prices at the pump is not necessarily extreme.

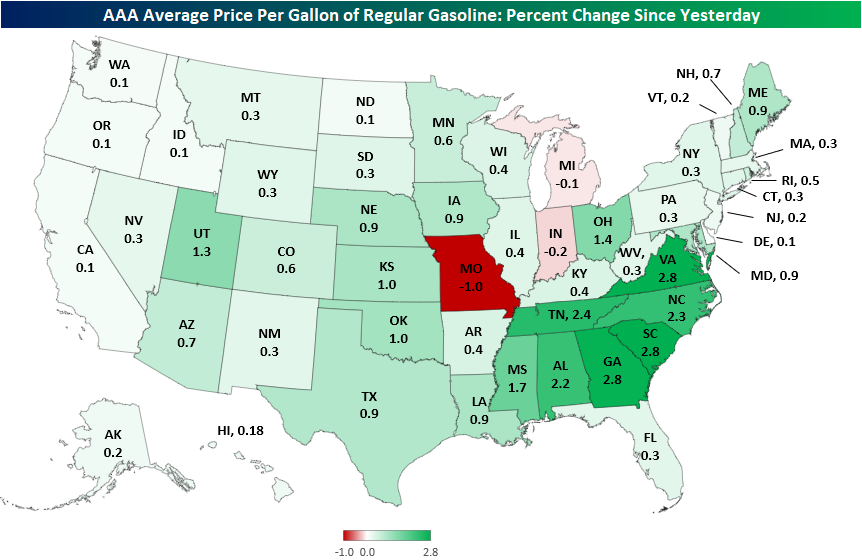
As previously mentioned, the Colonial Pipeline is a major piece of energy infrastructure on the East Coast. In other words, while the national average of gas has risen sharply as a result of the event, the largest increases have been concentrated to a specific region of the country: the Southeast. In the heatmap below, states colored with deeper shades of green indicate those where the average price of a gallon of gas have risen the most in the past week.
Places like Georgia, Alabama, and the Carolinas (all of which the Colonial Pipeline pass through) have seen their states’ average gas prices rise in the mid-to-high single-digit percentage range over the past week; the highest increases in the country. Moving further north along the Eastern Seaboard, the increases in gas prices become less steep but still notable. The vast majority of states in the Midwest, New England, and Mid Atlantic have seen prices rise only in the 2 to 3% range. The same applies to the states in the heartland. But moving further out West, price appreciation has been even smaller. Most Western states have seen the average gas price rise in the 1% range, which is exactly what you would expect to see at this time of year.

Looking at price changes in the past day alone, it is largely the same story. Much of the South has seen prices rise the most rapidly while prices further North have not risen by nearly as much. In fact, states like Missouri, Indiana, and Michigan actually saw prices move slightly lower. Again, the West also has seen prices modestly higher.
Without diminishing any of the effects that the shock of a sharp uptick in prices could have, we would also note that even after the significant appreciation, gas prices in the South remain some of the cheapest in the country. California and other West coast states still have the highest prices per gallon in the country while places like Louisiana and Mississippi have the cheapest. Click here to view Bespoke’s premium membership options for our best research available.
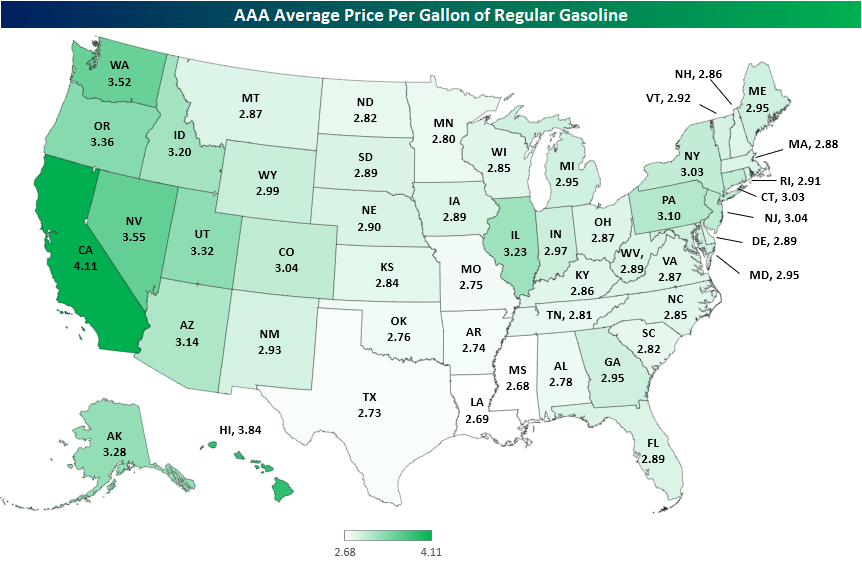
Chart of the Day – Apple (AAPL) Falls From the Tree
COTD Bullet Points:
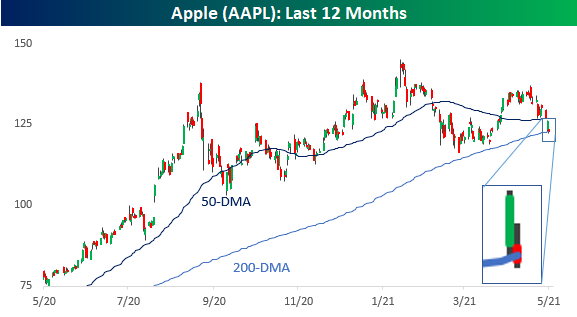
- Apple (AAPL) is on pace to close below its 200-DMA for the first time in more than a year.
- Going back to the early 1980s, there have been seven other streaks that lasted a year or more.
- Following the end of prior streaks of closing above its 200-DMA, AAPL tended to see additional short-term weakness but was higher three months later every single time.
Chart of the Day:
It’s been a rough several days for a lot of stocks, including the S&P 500’s largest stock – Apple (AAPL). Yesterday, the stock saw a successful test of its 200-DMA, but the bounce didn’t last long, and while some time remains in the trading day, the stock is on pace to close below that level for the first time in more than a year. Warren Buffett commented earlier this month that selling some of his holdings in AAPL was ‘probably a mistake,’ but as the stock sells off, the trade is looking better and better. Let’s just hope that for the broader market’s sake (it is the largest stock in the S&P 500) that Buffett’s ‘mistake’ doesn’t end up being that he didn’t sell his entire stake. After all, AAPL’s average closing price in Q4 2020 (the quarter that Buffett sold shares) was $120.28, and as of this afternoon, the stock is barely hanging on to $120.00.
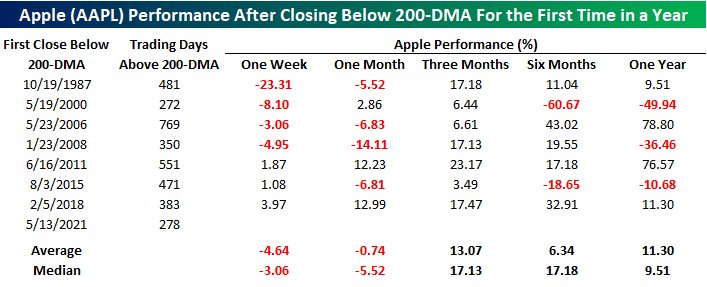
As mentioned above, AAPL has closed above its 200-DMA every day for more than a year. That’s not the longest streak in the stock’s history, but it is one of the longest. The last time there was a streak that lasted longer was in the 383 trading days ending in February 2018 after the volatility crash. In the post-financial crisis period, the current streak is the fourth such streak of more than a year, and going back to the early 1980s, there have been seven other streaks that lasted a year or more.

Now that AAPL is on the verge of ending this streak, what now? The table and chart below show AAPL’s performance following the end of prior streaks where the stock went a year or longer without closing below its 200-DMA. For each period, we show the stock’s performance from the close on the first day that the stock closed below the 200-DMA. AAPL’s performance over the following week and month has been mixed with a downward bias as the stock’s median performance was a decline of 3.06% and 5.52%, respectively. Three months later, the stock tended to turn around posting a median gain of 17.1% with gains all seven times. Moving out over the next six and twelve months, though, returns turned more mixed. While the stock still saw positive returns on both an average and median basis, the magnitude of the gain wasn’t any larger than the three-month average and median returns. More often than not, in fact, the stock’s six-month performance was lower than the three-month performance. In other words, while the stock bounced in the short to intermediate-term, it started to run out of gas from there.

“Inflation” Trends
You know it’s getting bad when inflation starts to trend on Twitter, but that’s where we find ourselves this morning with the terms ‘#GasShortage2021’ and ‘#inflation’ both trending on our Twitter feed.

On Google, the frequency of searches for the term inflation looks like it’s on its own path straight to the moon.

These real-time indicators of concerns over inflation also manifested themselves in the ‘official’ inflation data this morning as y/y CPI surged to 4.2%, eclipsing the prior post-financial crisis highs. Not only that, but if CPI is unchanged on a m/m basis in May (highly unlikely), the y/y reading will climb to 4.3% given the decline last May. If we assume that May’s m/m change is the same as the average so far this year, it would imply a 4.8% y/y change.

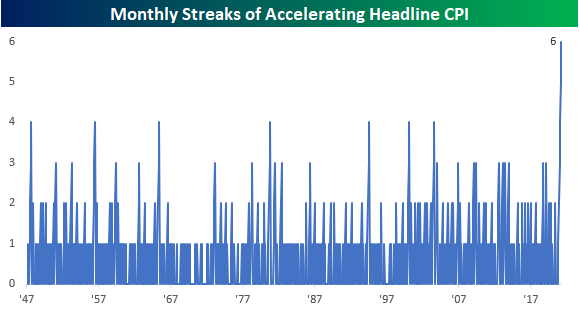
Even assuming that inflation only rises at the average m/m rate so far this year may be conservative at this point. That’s because the rate of increase on a m/m basis has now accelerated for six straight months. Going all the way back to the 1940s there’s never been a streak that long. Just for some perspective, if CPI increases by the same rate in May as it did in April, headline CPI will clock in at 5.1%.
While the current level of CPI looks very high relative to the post-financial crisis period, from a longer-term perspective, it still has yet to show signs of breaking out from its thirty-year range. Based on the pain from prior spikes, let’s hope it stays that way. Click here to view Bespoke’s premium membership options for our best research available.

Bespoke’s Morning Lineup – 5/12/74 – INFLATION
See what’s driving market performance around the world in today’s Morning Lineup. Bespoke’s Morning Lineup is the best way to start your trading day. Read it now by starting a two-week free trial to Bespoke Premium. CLICK HERE to learn more and start your free trial.
“Inflation is not all bad. After all, it has allowed every American to live in a more expensive neighborhood without moving.” – Alan Cransto
Inflation has its name in lights this morning as gas prices surge across the country as the Colonial Pipeline outage threatens energy supplies on the East Coast of the United States. April CPI was just released, and while economists’ forecasts called for a m/m increase of 0.2% at the headline level and 0.3% on a core basis, the actual readings came in at 0.8% and 0.9%, respectively. The headline reading was the biggest gain since 2009, while the core reading hasn’t been this high since the early 1980s. On a y/y basis, headline CPI was 4.2% (highest since 2008) and core CPI was 3.0% (highest since 1996). While the high levels were expected, not many were expecting them to be this high.
Read today’s Morning Lineup for a recap of all the major market news and events including a recap of overnight earnings reports and economic data, a look at some key market charts from Asia and Europe, EZ Industrial Production, as well as the latest US and international COVID trends including our vaccination trackers, and much more.

Technology may have received the most attention for this week’s declines, but it has been far from alone. The chart below summarizes the week-to-date performance of the S&P 500 and each of the eleven sectors through Tuesday’s close. Over the last two days, Technology isn’t even the worst performer. That title belongs to Consumer Discretionary which is down 2.86%. Not far behind, Technology is down 2.77%, while Energy is down 2.61%. The only other sector down more than the S&P 500 is Communication Services (-2.43%). On the upside, or more accurately, the less bad side, Materials, Consumer Staples, and Utilities are all down less than 0.20%. It’s interesting to see that the two commodity-related sectors – Energy and Materials both have vastly different returns WTD.

Daily Sector Snapshot — 5/11/21
Small Businesses Growingly Concerned About Inflation
In today’s Morning Lineup, we covered some of the details of this morning’s release of the NFIB’s monthly survey on small business sentiment. The survey showed rising prices, tight labor market conditions, and overall improving demand.
The NFIB also surveys businesses on what they consider to be their single most important issues. For the majority of businesses, cost or quality of labor and government requirements or taxes are the most prevalent. In total, 64% of businesses reported one of these as the biggest problem. Meanwhile, the percentage of businesses reporting weak sales as the most pressing issue continues to fall which is indicative of a further recovery in demand. One other interesting decline was in the issue of competition from ‘big business’. Only 7% of businesses reported this as their biggest problem which is the lowest reading since October 2017. While up 1 percentage point in April, cost or availability of insurance is also still around some of the lowest levels of the past decade. While that mention of costs has ticked only slightly higher similar to the cost of labor which rose 1 percentage point in April, inflation more broadly is increasingly on the minds of small businesses. 6% of businesses reported higher prices as the biggest issue which is triple the reading from February and is the highest level since August 2013.Click here to view Bespoke’s premium membership options for our best research available.

“Druck” vs the Fed
Futures were already weak Tuesday morning but then took another leg lower following a CNBC appearance by Stanley Druckenmiller where he discussed his WSJ op-ed outlining his views of Fed Policy titled “The Fed is Playing With Fire”. Some of the excerpts of the column give a little more detail as to Druckenmiller’s opinions of Fed policy.
Yet the Fed regularly distorts the most important price of all—long-term interest rates. This behavior is risky, for both the economy at large and the Fed itself.”
America’s deep divisions also make the central bank’s independence crucial. Fighting inequality and climate change are very far from the Fed’s central mission. There’s a reason central bankers are supposed to be unpopular.
Fed policy has enabled financial-market excesses. Today’s high stock-market valuations, the crypto craze, and the frenzy over special-purpose acquisition companies, or SPACs, are just a few examples of the response to the Fed’s aggressive policies.
What made the timing of Druckenmiller’s op-ed interesting is the fact that it came on a day that numerous FOMC officials were already scheduled to speak. Despite Druckenmiller’s criticism, though, FOMC officials were unfazed. Below are just a sampling of the headline comments made throughout the day.
Mester: Want to see more, broader progress in recovery.
Brainard: Uncertainty remains; jobs, inflation far from goals.
Daly: Hopeful economy will climb out of virus hole by next year.
Bostic: Long way to go…appropriate to stay in accommodative mode.
Harker: Let’s see how the job market heals before talking taper.
Kashkari: Long way from maximum employment.
Bullard: Too early to talk taper.
Over the last several months, there’s been an interesting divergence between Fed officials and market expectations for Fed policy. While the Fed says one thing (‘steady as she goes), the market is having trust issues and keeps thinking that the Fed will start to remove accommodation sooner than expected. Whether or not you agree with their policies, you have to ask yourself, do the excerpts above sound like the type of comments you’d hear from a Fed that was losing confidence in the current state of monetary policy? Click here to view Bespoke’s premium membership options for our best research available.
Bespoke Stock Scores — 5/11/21
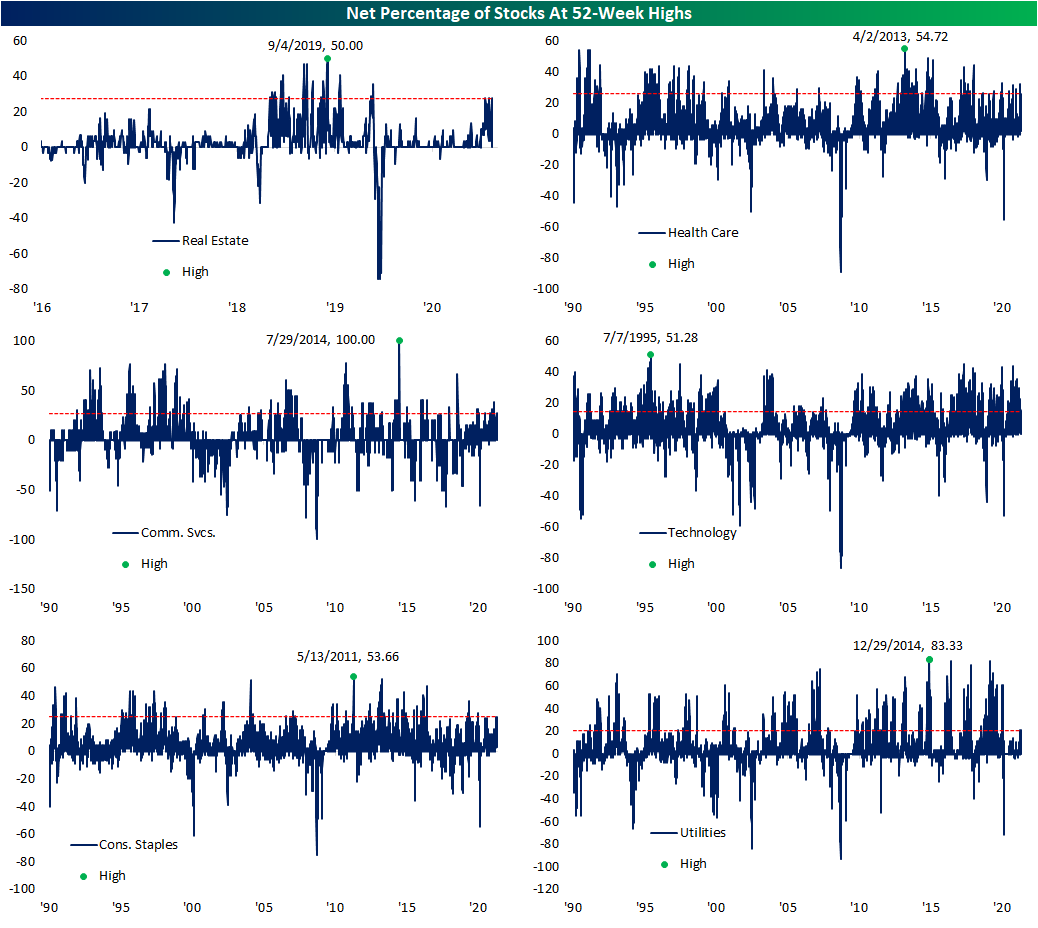
Record Highs in 52-Week Highs
Although equities are lower today, for a large portion of stocks these declines represent reversals from 52-week highs. In the charts below, we show the daily readings in the net percentage of stocks reaching 52-week highs across the S&P 500 and multiple sectors since 1990. While not even 1% of S&P 500 stocks have reached a 52-week high today, yesterday a net of 44.55% of stocks did so. Going back to at least 1990, that is the strongest reading in net new highs on record. The same could be said for Materials, Industrials, and Financials. The latter saw the strongest reading of these as 84.62% of the sector hit a 52-week high. Materials were also strong with three-quarters of the sector at a new high while the Industrials sector reading was lower but also at an impressive 63.51%.
While they did not hit a record high, Consumer Discretionary and Energy both also saw elevated readings of 47.62% and 52.17%, respectively. For Consumer Discretionary, the only higher readings came in April of 2010 with some similar but slightly lower readings also in the fall of 2013. Meanwhile, just over half of Energy stocks were at a 52-week high, and although the reading as recently as March was higher almost hitting 70%, yesterday still managed to land itself in the 99th percentile of all days since 1990.
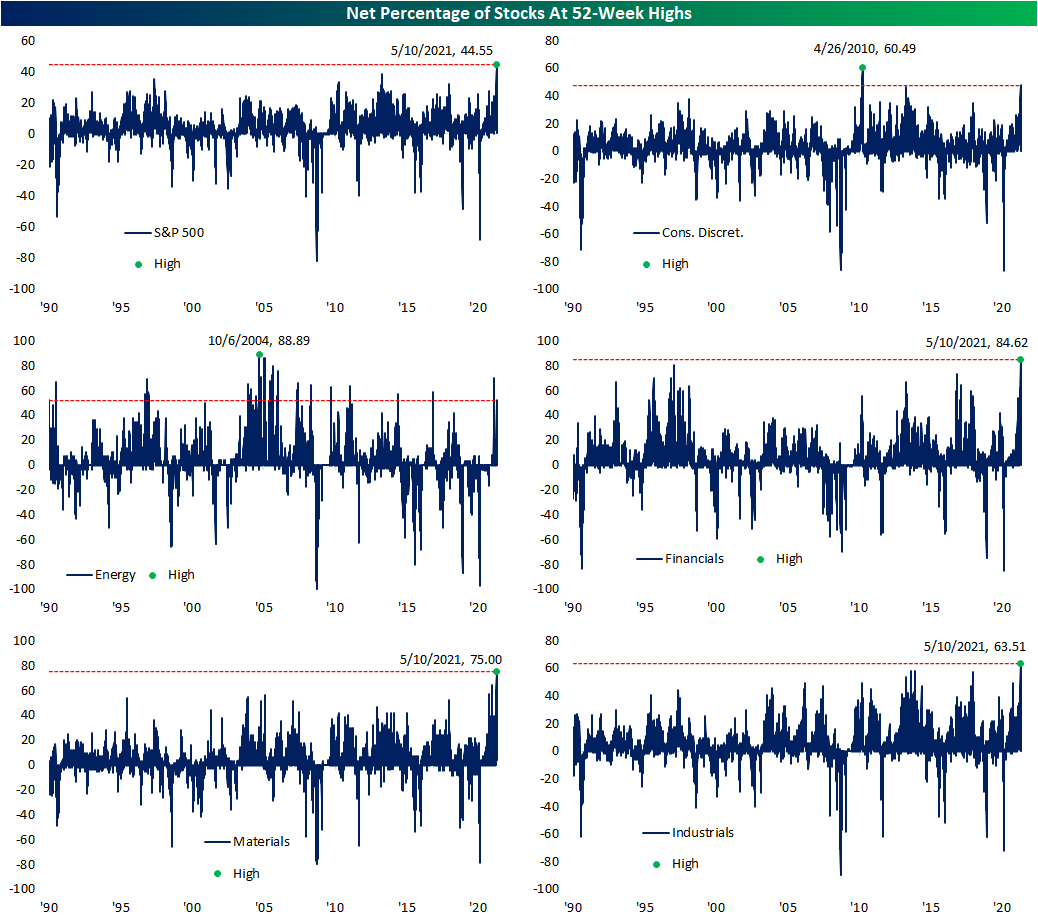
As for other sectors, the readings yesterday were not as close to record highs but were still impressive. Just about every other sector saw a reading in the top 5% of all periods with a single major exception: Technology. Only 14.67% of stocks in the sector traded at a new high yesterday. While that is still indicative of solid breadth in the 88th percentile of all periods, it pales in comparison to the rest of the S&P 500. Click here to view Bespoke’s premium membership options for our best research available.