High Flyers At Much Lower Altitudes
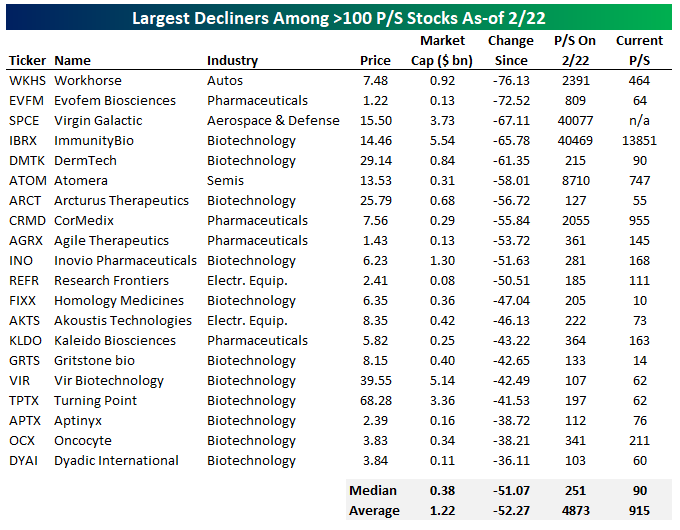
Stocks with extreme valuations have taken a serious haircut since the space peaked on February 22nd. On that date, 59 stocks in the Russell 3000 had a price-to-sales multiple north of 100x. That group had a median price-to-sales multiple of more than 311x on that date. Today, those 59 stocks have a price-to-sales multiple that’s 53.6% lower than it was February 22nd. That compares with a median price decline of 25.4% among the 59 stocks, or -22.5% weighted by market cap. In other words, while prices in this group have been hit very hard, their valuation has compressed substantially more.

Below we show the 20 stocks out of the 59 that have seen the largest drops in price since February 22nd. Among this worse-performing subset, the median stock has plunged 51%, in-line with the median 58% drop in price-to-sales since February 22nd. Despite the huge drops in prices over the last few months, these names are still very aggressively valued at a median price-to-sales multiple of 90x. Virgin Galactic (SPCE) has actually seen an infinite price-to-sales multiple after reporting zero revenue in its most recent quarter. From a valuation perspective, it’s still hard to call any of these stocks attractive. Click here to view Bespoke’s premium membership options for our best research available.
B.I.G. Tips – Retail Sales Stall
After a couple of days of much stronger than expected inflation data, the trend of higher than expected readings didn’t continue with Friday’s Retail Sales report. While economists were expecting sales to increase by 1.0% versus March, the actual level was unchanged. After subtracting Autos and Gas, the report was even weaker showing a decline of 0.8%. While the April report was a disappointment, it wasn’t all bad; March’s report was revised higher by nearly the same amount that April’s report missed expectations by.
Since the outset of the COVID pandemic, there have really been some crazy swings in economic data. One example is the total share of Retail Sales that Food & Beverage Stores account for. Prior to COVID, the sector’s share of total sales had been slowly drifting lower over time in the low-double-digit percentage range. The COVID lockdowns really changed that, though. Over the course of a month from February to March 2020, the sector’s share of total sales spiked from just over 12% to more than 17%. Obviously, Americans weren’t suddenly eating more (at least not that much more), but with the economy locked down, they literally couldn’t spend money on anything but the essentials like food, liquor, and lottery tickets. Additionally, for the food they did eat, they were forced to buy it at the grocery store rather than at restaurants.
As the lockdowns ended and Americans were able to spend again, the sector’s share of total sales started to decline again. While a reversion back down to its baseline level was expected, the sector now actually accounts for a lower percentage of total sales than it did before the pandemic! Just as Americans weren’t necessarily eating more during the pandemic, they aren’t eating less now that the pandemic has ended. The reason that the sector’s share of total sales has dropped below pre-pandemic levels is the exact opposite of why its share spiked so much during the pandemic. Americans aren’t spending more or less on food now than they did before or during the pandemic, but instead, the pie is a lot larger now (thanks to savings and stimulus) and they are choosing to spend that food money at restaurants and takeout rather than at the grocery store.

In our just-released B.I.G. Tips report, we broke out the details of the April report including its bright and dark spots. For anyone with more than a passing interest in how the COVID outbreak and subsequent stimulus is impacting the economy, our monthly update on retail sales is a must-read. To see the report, sign up for a monthly Bespoke Premium membership now!
Bespoke’s Morning Lineup – 5/14/21 – Retail Sales Reset
See what’s driving market performance around the world in today’s Morning Lineup. Bespoke’s Morning Lineup is the best way to start your trading day. Read it now by starting a two-week free trial to Bespoke Premium. CLICK HERE to learn more and start your free trial.
“End? No, the journey doesn’t end here.” – J.R.R. Tolkien
If you thought that with this week’s inflation data now behind us that we could coast into the weekend, think again. There’s a ton of data on the calendar this morning, including Retail Sales, Industrial Production, and Michigan Confidence. Futures are building on yesterday’s gains after quiet sessions in Asia and Europe, but that could change following the data releases.
Read today’s Morning Lineup for a recap of all the major market news and events including a recap of overnight earnings reports and economic data, as well as the latest US and international COVID trends including our vaccination trackers, and much more.

It’s been a rocky week for the market, but the overall trend has been lower this week. Over the last five trading days, all eleven S&P 500 sectors are in the red with Consumer Discretionary (-4.66%), Technology (-3.48%), and Communication Services (-2.69%) all trading down at least 2.5%. Sectors that have held up the best include Consumer Staples (-0.06%), Materials (-0.16%), Health Care (-0.32%), and Utilities (-0.38%) which are all down less than half of one percent. Despite the broad-based declines over the last week, not a single sector is oversold, only two are below their 50-DMA, and five are still overbought.

Bespoke’s Weekly Sector Snapshot — 5/13/21
The Bespoke 50 Top Growth Stocks – 5/13/21
Every Thursday, Bespoke publishes its “Bespoke 50” list of top growth stocks in the Russell 3,000. Our “Bespoke 50” list is made up of the 50 stocks that fit a proprietary growth screen that we created a number of years ago. Since inception in early 2012, the “Bespoke 50” is up 453.2% excluding dividends, commissions, or fees. Over the same period, the Russell 3,000’s total return has been +256.5%. Always remember, though, that past performance is no guarantee of future returns. (Please read below for more info.) To view our “Bespoke 50” list of top growth stocks, please start a two-week trial to either Bespoke Premium or Bespoke Institutional.

The Bespoke 50 performance chart shown does not represent actual investment results. The Bespoke 50 is updated weekly on Thursday. Performance is based on equally weighting each of the 50 stocks (2% each) and is calculated using each stock’s opening price as of Friday morning each week. Entry prices and exit prices used for stocks that are added or removed from the Bespoke 50 are based on Friday’s opening price. Any potential commissions, fees, or dividends are not included in the performance calculation. Performance tracking for the Bespoke 50 and the Russell 3,000 total return index begins on March 5th, 2012 when the Bespoke 50 was first published. Past performance is not a guarantee of future results. The Bespoke 50 is meant to be an idea generator for investors and not a recommendation to buy or sell any specific securities. It is not personalized advice because it in no way takes into account an investor’s individual needs. As always, investors should conduct their own research when buying or selling individual securities.
VIX Spikes
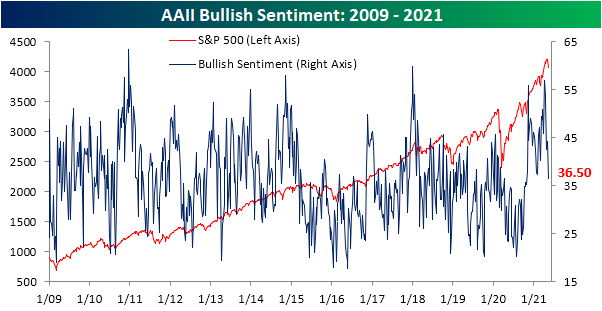
Bullish Sentiment Down Big
The past week has been one of the worst short term runs for the major indices of the past several months, and sentiment this week is reflecting that negative price action. Bullish sentiment as measured by the AAII weekly sentiment survey took a spill, dropping 7.8 percentage points to 36.5%. Whereas just over a month ago bullish sentiment hit a multi-year high at 56.9%, this week’s reading was the lowest since the last week of October.
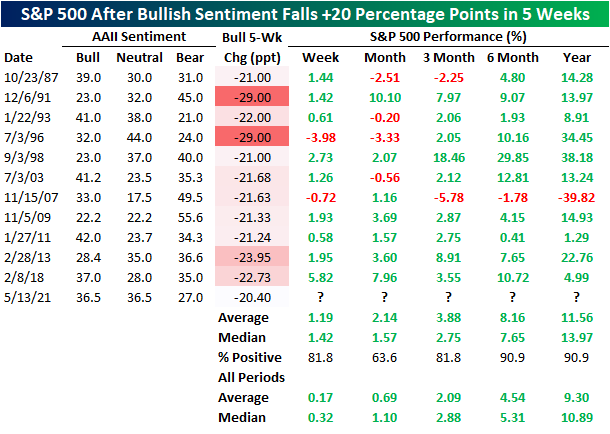
The over 20 percentage point decline in that time was the biggest drop in a span of five weeks since a 22.73 percentage point decline in the five weeks ending February 8th, 2018. In the table below, we show the past 11 periods in which bullish sentiment fell by at least 20 percentage points in five weeks without another occurrence in at least a year. Overall, they have consistently preceded solid runs for the S&P 500 with frequent moves higher that are on average larger than the norm. One and three months later have both seen the S&P 500 trade higher 81.8% of the time and a half year to a full-year out has seen the index lower only one time (in 2007). Additionally, each of the prior instances since 2009 has been marked by the S&P 500 trading higher across all time frames.
With bullish sentiment lower, bearish sentiment gained 3.9 percentage points. At 27%, it is at the highest level since early February though still a few percentage points above the historical average of around 30%.

That has resulted in the bull-bear spread dropping 11.7 points to 9.5. That is the first single-digit reading in the spread since the first week of February, but it still indicates that overall sentiment remains biased towards the bulls.

While bearish sentiment has only risen modestly, neutral sentiment is flying. After gaining another 4 percentage points this week, neutral sentiment hit the highest level since the second week of 2020. Similar to bullish sentiment, the move higher in neutral sentiment over the past few weeks has been one of the largest in roughly three years. Click here to view Bespoke’s premium membership options for our best research available.

Impressive Initial Claims; Anticlimactic Continuing Claims
Last week’s initial jobless claims number had been the first break below 500K since the pandemic began. Although that no longer applies this week after a 9K revision higher to 507K, initial claims continue to impress as the most recent print saw a more considerable break below 500K. Claims this week fell 34K to another new low of 473K. In total over the past two weeks, initial jobless claims have now fallen 117K.

On a non-seasonally adjusted basis, regular state claims combined with claims from the Pandemic Unemployment Assistance (PUA) program totaled 590.97K this week; another pandemic low. The lion’s share of these claims are of the regular state programs as only 103.57K are PUA claims. That reading was ever so slightly higher this week (up 1.76K) and remains just off the lowest level of the pandemic.

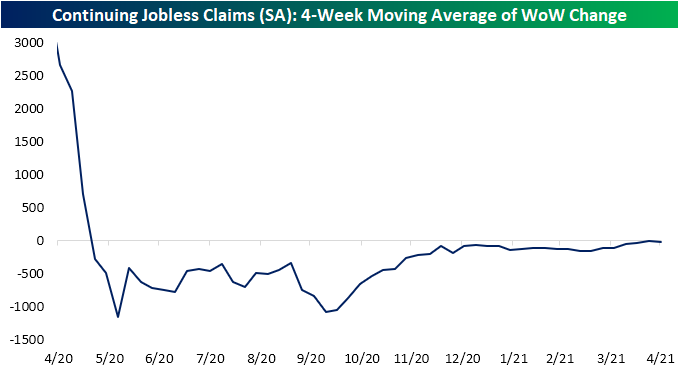
While initial claims have seen great progress over the past several weeks, continuing claims continue to be a bit more disappointing. For the first time since the week of April 9th, seasonally adjusted continuing claims did finally fall, dropping 45K to 3.655 million, but that was 5K less than the decline that had been penciled in by economists. Overall, the general trend remains the same. Whereas there were massive improvements throughout much of 2020, the pace of those improvements slowed last fall. From the end of 2020 through the end of March, claims had averaged around a 100K decline per week. Since the start of April, it has slowed even further with claims averaging only a 14K decline over the past four weeks as shown in the second chart below.

The picture is slightly better when including all programs (although this data is lagged by an extra week). Through the week of April 23rd, total continuing claims across all programs rose 697K to 16.884 million. While lower than most of the pandemic, that had erased the prior two weeks moves lower and was the largest one-week uptick since the first week of March. That uptick was driven almost entirely by PUA claims and Pandemic Emergency Unemployment Compensation. Click here to view Bespoke’s premium membership options for our best research available.


Chart of the Day: Axcelis Tech (ACLS)
Bespoke’s Morning Lineup – 5/13/21 – Inflation: Part II
See what’s driving market performance around the world in today’s Morning Lineup. Bespoke’s Morning Lineup is the best way to start your trading day. Read it now by starting a two-week free trial to Bespoke Premium. CLICK HERE to learn more and start your free trial.
“Learn to take losses. The most important thing in making money is not letting your losses get out of hand.” – Marty Schwartz
After yesterday’s shockingly high headline readings in CPI, it was a tentative picture in markets ahead of the April PPI. While consensus expectations called for a m/m increase of 0.3% at the headline level and an increase of 0.4% on a core basis, the actual numbers once again came in higher than expected although not to the same degree as Wednesday’s CPI (0.6% headline, 0.7% core). Like the movies, the sequel is never as exciting as the original. PPI wasn’t the only report on the calendar this morning, though. Jobless claims came in a bit lower than expected on an initial basis and a bit higher on a continuing basis.
Futures were indicated flat to higher into the report with the Nasdaq leading the way, but they are also off overnight highs as well. Commodities are trading heavy this morning, while bitcoin is plunging following a tweet by Elon Musk that Tesla would no longer accept payment in bitcoin until it was mined in more environmentally friendly ways.
Read today’s Morning Lineup for a recap of all the major market news and events including a recap of overnight earnings reports and economic data, a look at some key commodities, as well as the latest US and international COVID trends including our vaccination trackers, and much more.
Over the last three trading days, the Nasdaq is down over 5%, and while that is a steep decline for such a short period of time, it’s hardly unprecedented in the Nasdaq’s history. What is unique about the current decline is just how steep the losses have been in the US Treasury market. While higher rates are bad for growth stocks, normally, when you see a decline so large in the equity market, bonds provide a cushion. Along with the 5%+ decline in the Nasdaq, long-term US Treasuries are also down over 2%. Going back to 1987, there have only been eight other three-day periods where the Nasdaq was down over 5% and long-term US Treasuries dropped more than 2% (highlighted in the chart below).
