Daily Sector Snapshot — 6/2/21
Chart of the Day – Semis Range Narrows
S&P 500 Returns Relative to History
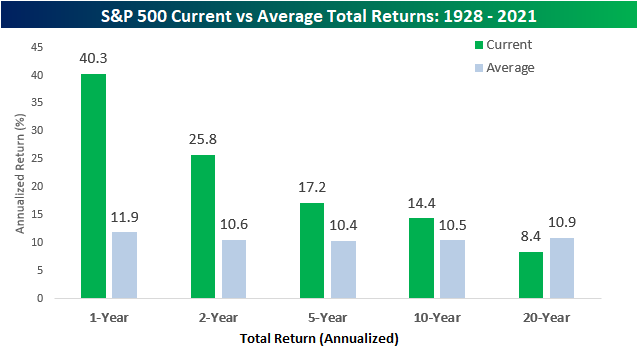
May has moved back to the rearview mirror and with that, we wanted to provide an update on how current long-term returns for the S&P 500 stack up relative to history. The chart below compares the trailing one, two, five, ten, and twenty-year annualized total returns of the S&P 500 to the S&P 500’s historical average returns over those same time periods since 1928.
We’re starting to move away from the ‘easy comps’ in terms of market returns relative to the March 2020 lows, but the S&P 500 is still up more than 40% over the last 12 months which is nearly four times the historical average one year return. Over the last two years, the S&P 500’s annualized return of 25.8% still comes in at more than twice the historical average of 10.6%. On a five and ten-year basis, the S&P 500’s annualized gain also remains comfortably above 10%. All in all, the last decade has been very good for US equity investors. The only time period where the S&P 500 has experienced below-average returns is at the 20-year window where the 8.4% annualized gain clocks in at 2.5 percentage less than the historical average of 10.9%.
The chart below compares the S&P 500’s current returns over the last one, two, five, ten, and twenty years to all other periods on a percentile basis. With mostly above-average returns, it comes as no surprise that most of the percentile readings rank above the 50th percentile, and for most time periods, the percentile rank comes in well above 50%. The one-year total return of more than 40% actually ranks just above the 93rd percentile, while the two-year return isn’t far from the 90th percentile either. Moving further out, each of the other readings going out to ten years are all well above the 50th percentile. The only percentile rank below the 50th percentile is the 20-year window and that reading isn’t even close. On the one hand, the last ten years have been phenomenal for equity investors, but the last 20 years haven’t even been mediocre.

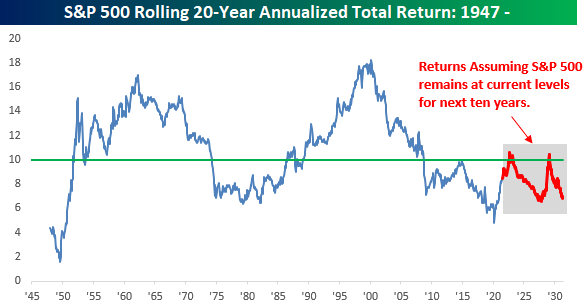
Throughout history, many investors have always worked under the assumption that long-term returns for the equity market are about 10%. History has shown that to be the case over the last decade at least, as the average annualized one-year gain of the S&P 500 has been well above 10%. With the S&P 500’s current 20-year annualized gain currently at just 8.4%, though, what will it take for the S&P 500 to reach double-digit gains on an annualized basis over a 20-year window?
For an idea, given the strong performance of the last ten years, a number of commentators suggest that the next ten years for equities will be weak with a reversion to the mean. Only time will tell, but if we operate under the (unlikely) assumption that the S&P 500 stays at the exact same level it is now going forward for the next ten years, its annualized twenty-year return would top 10% for the first time since August 2008 next September. After that brief period above 10% from September 2022 through March 2023, it wouldn’t again top that level until February 2029. In spite of the fact that the annualized 20-year return would top 10% in those two periods, though, it still wouldn’t get as high as the historical average of 10.9% in either of those periods. This reflects the fact that although the last ten years for US equities have been very strong, they also came shortly after one of the worst ten-year periods for US equities on record. Click here to view Bespoke’s premium membership options.
Bespoke’s Consumer Pulse Report – June 2021
Bespoke’s Consumer Pulse Report is an analysis of a huge consumer survey that we run each month. Our goal with this survey is to track trends across the economic and financial landscape in the US. Using the results from our proprietary monthly survey, we dissect and analyze all of the data and publish the Consumer Pulse Report, which we sell access to on a subscription basis. Sign up for a 30-day free trial to our Bespoke Consumer Pulse subscription service. With a trial, you’ll get coverage of consumer electronics, social media, streaming media, retail, autos, and much more. The report also has numerous proprietary US economic data points that are extremely timely and useful for investors.
We’ve just released our most recent monthly report to Pulse subscribers, and it’s definitely worth the read if you’re curious about the health of the consumer in the current market environment. Start a 30-day free trial for a full breakdown of all of our proprietary Pulse economic indicators.

B.I.G. Tips – Real Estate Building Up
Bespoke’s Morning Lineup – 6/2/21 – Small Lead
See what’s driving market performance around the world in today’s Morning Lineup. Bespoke’s Morning Lineup is the best way to start your trading day. Read it now by starting a two-week free trial to Bespoke Premium. CLICK HERE to learn more and start your free trial.
“Do not anticipate and move without market confirmation—being a little late in your trade is your insurance that you are right or wrong.” – Jesse Livermore
It’s a quiet morning as there’s little in the way of major economic releases today. There were a handful of earnings reports overnight from the likes of Advanced Auto (AAP), Hewlett Packard (HPE), and Zoom (ZM). Futures have been trading with a modestly positive bias all night and remain that way this morning. In politics, President Biden is scheduled to meet with Republicans today to try and reach some sort of consensus on infrastructure so we’ll be watching this afternoon for any updates on that front.
Read today’s Morning Lineup for a recap of all the major market news and events including a recap of some notable earnings reports, major economic data out of Asia and Europe, a discussion of the Chinese Property market, and the latest US and international COVID trends including our vaccination trackers, and much more.

Relative to where they opened yesterday, both the S&P 500 and Nasdaq had disappointing closes finishing near their lows of the day. The small-cap Russell 2000, however, was a different story. While it also experienced a small pullback from its opening levels in early trading, it rebounded and finished near its highs of the day.

From a longer-term perspective, yesterday’s late-day strength in the Russell 2000 sets the stage today for a test of its downtrend from the early March high as it closed yesterday just below its downtrend line. In pre-market trading right now, the Russell 2000 is slightly positive, so as long as those gains can hold, the technical picture for small caps will look incrementally better.

Daily Sector Snapshot — 6/1/21
Bespoke Stock Scores — 6/1/21
Meme Stocks Back in Focus
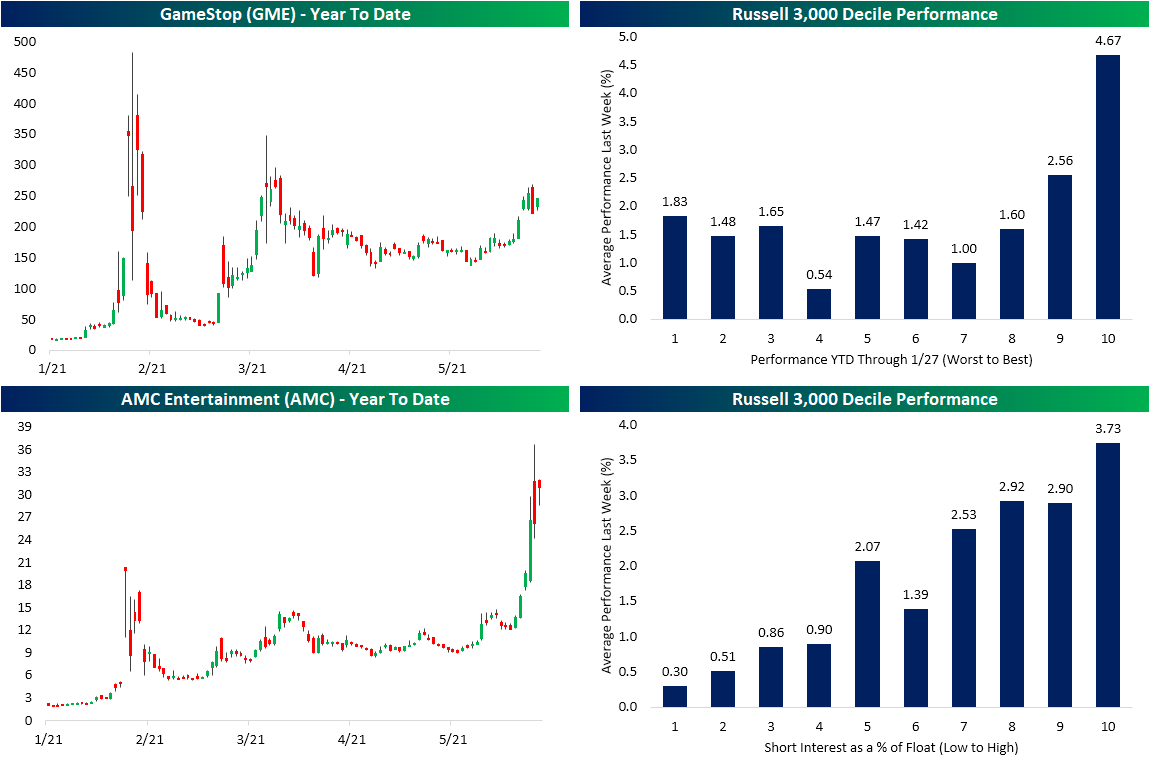
In the past week, the meme stocks like GameStop (GME) and AMC Entertainment (AMC) have come back in focus with each name making explosive moves to the upside which resulted in them being some of the top-performing stocks in the Russell 3,000 last week. In the case of GME, the stock was up over 50% on the week at the intraday highs on Friday. In spite of those big gains, GME was still left a few percentage points below the March closing highs and even further below the peak short squeeze highs from late January. Meanwhile, AMC saw an even more sensational move that left its prior highs in the dust. At its highs on Friday, AMC was sitting on an over 200% gain on the week which was just over 80% above the January 27th high. Similar to GME, the highs on Friday did not hold through the end of the day as the stock ultimately closed down 1.5% versus Thursday’s close. Starting off the shortened week, both GME and AMC are resuming huge moves higher with the stocks up 11.58% and 24.66%, respectively, as of this writing. Granted, even with those massive moves, both stocks are seeing an inside day.
Looking beyond two of the poster children of the short squeeze saga, performance last week was marked by a return to themes that were present in the period in January. As shown in the top-right chart below, the same stocks that were up the most year to date through January 27th (the day of the original highs of both GME and AMC) were again the top performers last week. That decile of Russell 3,000 stocks on average were up 4.67% last week. Another identical theme of performance to January observed last week was with regards to heavily shorted names. The deciles of the most highly shorted stocks—to which AMC and GME both still belong—were also some of the top performers last week. The decile of the most heavily shorted names rose 3.73% on average. Meanwhile, the least heavily shorted stocks on average only gained 0.3%.Click here to view Bespoke’s premium membership options.
Bespoke Market Calendar — June 2021
Please click the image below to view our June 2021 market calendar. This calendar includes the S&P 500’s average percentage change and average intraday chart pattern for each trading day during the upcoming month. It also includes market holidays and options expiration dates plus the dates of key economic indicator releases. Start a two-week free trial to one of Bespoke’s three research levels.
