Daily Sector Snapshot — 7/14/21
S&P 500 Equalweight Lagging Badly
If you’ve been following the market over the last couple of months, you’ve likely noticed that the “mega-cap” stocks have been the main driver of the broad market’s move higher. You can really see this trend when looking at the performance disparity between the cap-weighted S&P 500 (SPY) and the equal-weight S&P 500 (RSP). (Just to be clear, the main S&P 500 index that’s tracked closely across the investment landscape is a cap-weighted index, meaning larger stocks have a bigger impact on its performance than smaller stocks. The lesser-followed equal-weight S&P 500 weights all 500 stocks in the index equally. In the equal-weight S&P 500, Apple (AAPL) — the largest stock in the index — and Unum Group (UNM) — the smallest stock in the index — have the exact same impact on the index’s performance.)
Yesterday was once again a bad day for most stocks as the equal-weight S&P 500 (RSP) fell more than 0.90% on the day. At the same time, the cap-weighted S&P 500 actually closed slightly higher on the day. As shown below, RSP has been stuck in a sideways pattern for the past two months, essentially going nowhere. SPY, on the other hand, has experienced a nice leg higher and is now very extended above its 50-day moving average. Over the last 12 trading days, SPY has closed at a new high 8 times while RSP has averaged a daily move of -0.02%. While the mega-cap growth stocks spent the time from late 2020 through early 2021 in consolidation, it’s not the smaller cap stocks in the index that look to have fallen asleep. Click here to view Bespoke’s premium membership options and sign up for a trial to any one of them.

While RSP has been trading sideways for the past couple of months, it’s actually still slightly ahead of SPY on a year-to-date basis.

As shown below, RSP’s YTD lead over SPY has been declining rapidly since peaking in May/June, however.

It’s the last two months that have caused RSP to give up nearly all of its 2021 outperformance versus SPY. As shown below, RSP is only up 0.33% over the last two months, while SPY is up 4.64%.
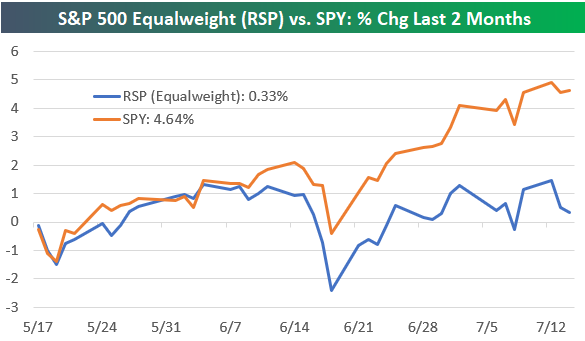
The recent underperformance we’ve seen from RSP is definitely outside the norm. Below we show the rolling 2-month performance spread between RSP and SPY since RSP began trading in 2003. There have only been two other periods where we’ve seen the 2-month performance spread turn more negative for the equal-weight S&P versus the cap-weighted S&P. The first was in late October/November 2008 when the entire market was falling rapidly during the Financial Crisis. The second was in late March 2020 during the COVID Crash. These two examples show that we normally see RSP significantly underperform SPY like this when the broad market is falling; not when it’s rallying to record highs on a seemingly daily basis. Click here to view Bespoke’s premium membership options and sign up for a trial to any one of them.

B.I.G. Tips – Years Like 2021: July Edition
Chart of the Day – Economic Indicator Diffusion Index Turns Negative
Bespoke’s Morning Lineup – 7/14/21 – More Inflation Data
See what’s driving market performance around the world in today’s Morning Lineup. Bespoke’s Morning Lineup is the best way to start your trading day. Read it now by starting a two-week free trial to Bespoke Premium. CLICK HERE to learn more and start your free trial.
“I continue to believe that the American people have a love-hate relationship with inflation. They hate inflation but love everything that causes it.” – William E. Simon
After yesterday’s doozy of a report on consumer price inflation, today the market is bracing for the latest read on prices in the producer sector. In addition to that, Treasury Secretary Jerome Powell will be addressing Congress later this morning.
Futures are higher heading into the report as Apple (AAPL) is leading the gains after it reportedly instructed suppliers to increase production by 20% this year. On the earnings front, the focus remains on financials where the market reaction to the reports has been mixed.
Read today’s Morning Lineup for a recap of all the major market news and events from around the world, the latest US and international COVID trends including our vaccination trackers, and much more.

After a brief decline immediately after the release of Tuesday’s June CPI, equity futures shook off the initial weakness and rallied solidly into the green. It wasn’t until the results of a 30-year bond auction at 1 PM that the equity market gave up the gains finishing in the red. The fact that equities and long-term treasuries were able to rally in the aftermath of the much stronger than expected CPI report and before the results of the auction was impressive, though. After all, at 5.4%, headline CPI rose at the fastest rate since July 2008 (5.6%) and before that 1991.
What’s also notable about the recent inflation pattern is that the y/y pace hasn’t declined in eight months now (longest streak since 2011), so the uptick in CPI has been persistent as the base effects from last year’s decline in CPI were in favor of larger increases. Looking back at 2020, the low point in CPI was May, and in June 2020 CPI rose by 0.5%, so while CPI was still well off its pre-COVID peak last June, this month’s report was the first y/y reading that wasn’t looking back at a period of declining CPI. To sum up, before this month’s report, all of the y/y readings were against relatively easy comps, but for June and going forward, the y/y readings will be looking back at periods where inflation was already back on the rise, so a continuation of these historically high readings against ‘tougher comps’ would likely quickly raise investor concerns.

Daily Sector Snapshot — 7/13/21
B.I.G. Tips – After Hours vs. Intraday Update
Bespoke Stock Scores — 7/13/21
2021 Gains Not Enough to Turn Energy Green
Below is a look at the path that S&P 500 sectors have taken in 2021. The Energy sector has been the clear standout from the start, taking a commanding lead early on and outperforming every other sector by more than 20 percentage points by the end of the first quarter. Since Q1, Energy has traded flat, however, which has allowed other sectors to play catch up. Even still, Energy is up 39% on the year, which is 12 percentage points better than the next best sector — Real Estate. The Financials sector ranks third best with a YTD gain of 26%. Utilities and Consumer Staples — both defensives — rank at the bottom of the pack with YTD gains of just 3-4%.

Looking back 12 months instead of on a year-to-date basis, Consumer Staples and Utilities remain the weakest, while it’s Financials that ranks first with a gain of 57%. Industrials ranks second at +52%, while Energy ranks third at +48%. Tech, Materials, and Communication Services have been the next best with gains of 43%.
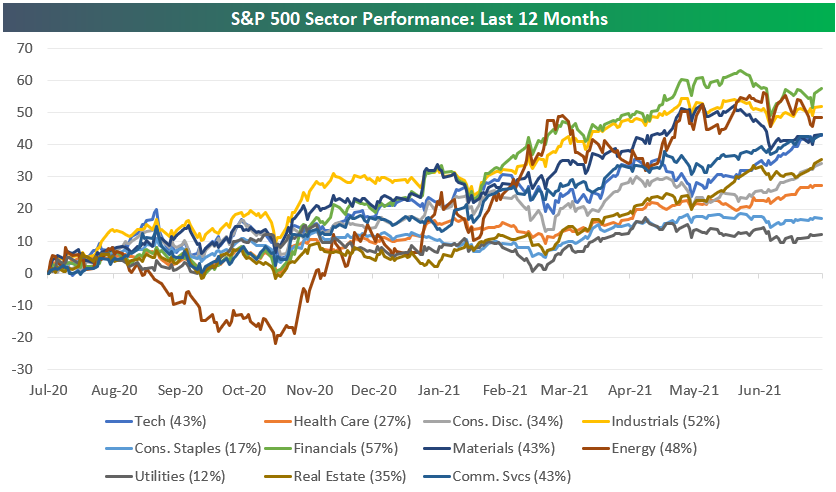
Looking even further back to the start of 2020 just before COVID hit, we see that Technology moves to the top of the list with a gain of 65%. Consumer Discretionary ranks second at +50%, followed by Communication Services at +49%.
While they’ve been some of the best sectors in 2021, Financials and Industrials are in the middle of the pack with gains of 20% and 27%, respectively, since the start of 2020.
Finally, the Energy sector — up 39% YTD and by far the best sector so far in 2021 — is actually still in the red with a decline of 13% since the start of 2020. So even after a massive move higher off of the COVID-Crash lows in March 2020, those who owned the Energy sector prior to COVID aren’t even back to even yet. Click here to view Bespoke’s premium membership options and sign up for a trial to any one of them.

Inflation Concerns Surge
The NFIB surveys small businesses each month asking respondents what the most pressing problem is for their business. In the May report, the most prominent problems were government regulations and taxes with 35% of businesses reporting as such. The next biggest problems were the cost and quality of labor. While labor-related issues remain a pressing concern for the bulk of businesses going unchanged at 34% in June, government-related problems fell off a cliff. The combined reading fell from 35% down to 29%. The combined six-point drop was the largest since an identical-sized month-over-month decline from December 2014 to January 2015. Another area to see a significant decline was Competition from Big Business which fell 2 percentage points to 6%; the biggest one month decline in a year. That was matched by an increase in the number of firms reporting poor sales as their biggest issue.
In an earlier post, we noted how the June NFIB survey of small businesses showed a surge in prices and wages. As such, the percentage of businesses reporting inflation as the biggest problem surged to the highest level in over a decade. That index alone rose 5 percentage points to 13%. November 2008 was the only other month on record in which this reading rose by as much as it did in June. While it was a far less alarming increase, there was also an uptick in the percentage of businesses stating the cost/availability of insurance is an issue, although, the current reading is still below that of just a couple of months ago.
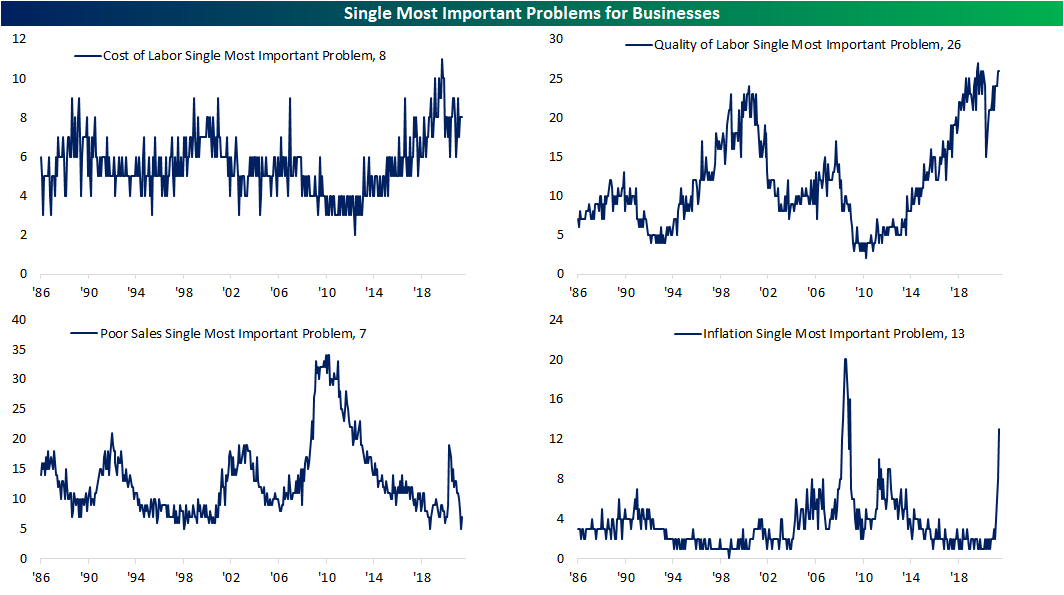
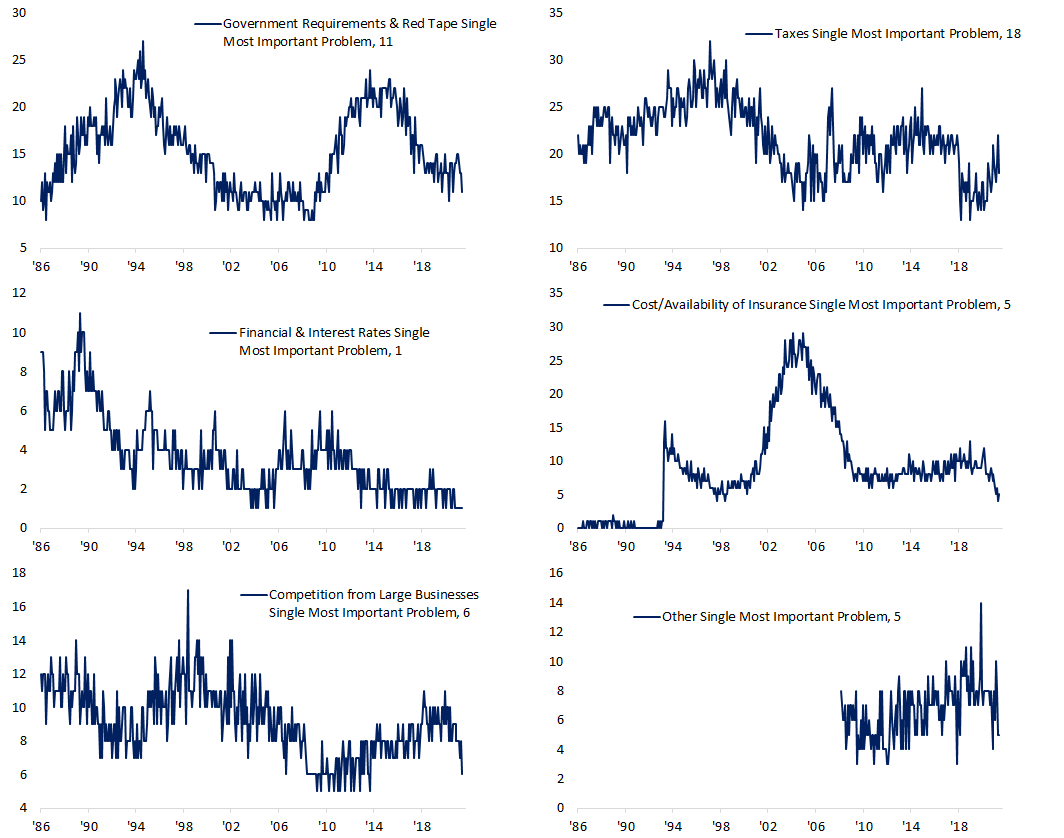
As previously mentioned, while businesses are less concerned with government-related problems, substituting for inflation concerns, the NFIB’s index of Economic Policy Uncertainty has been ticking higher over the past few months and is now at the highest level since around the time of the election although the current reading is still much more modest than back in the fall. Click here to view Bespoke’s premium membership options.
