The Bespoke Report — Don’t Stop Believin’
This week’s Bespoke Report newsletter is now available for members.
Fourteen years ago this week, the series finale (Made in America) aired for what many critics believe is the greatest television show in history — The Sopranos. The show, which was as much a critique of American culture as it was a mob story, ended with the Soprano family gathering for dinner in a New Jersey diner while Journey’s Don’t Stop Believin’ played.
Seeing the 14-year anniversary of Made in America got us thinking back to those days in spring 2007, because that’s right around the time when we launched Bespoke. Once we opened our doors, only a few months would pass before the Financial Crisis hit, upending the financial industry for a good 18-24 months. Yet Bespoke made it through, and we are forever thankful for those early clients (many of which are still with us) that signed up to read our reports like this one, the Bespoke Report newsletter. We don’t have an exact count, but based on 14 years of weekly publications, we should be at well over 600 releases by now!
There was not a lot going on in financial markets this week as the economic calendar was light and we’re right in the middle of the earnings off-season. US markets have been very calm since Memorial Day which is typical for this time of year. This week we saw minimal moves for the S&P 500. Monday saw a decline of 8 basis points, Tuesday saw a gain of 2 basis points, Wednesday saw a drop of 18 basis points, and on Thursday the index gained just under half a percent. We closed out the week on Friday with another small gain of 20 basis points.
Even though it was a slow week, there’s always plenty for us to cover, and we do so in this week’s Bespoke Report. Enjoy this week’s report, and have a great weekend. We’re now 10 days away from the longest day of the year, so take advantage of the nice weather and extended daylight while we have it!
To read the Bespoke Report and access everything else Bespoke’s research platform has to offer, start a two-week free trial to one of our three membership levels.


Daily Sector Snapshot — 6/11/21
Record Household Equity Exposure As Stock Markets Surge
Yesterday, the Federal Reserve updated its quarterly look at the balance sheets of macroeconomic sectors of the United States. One of the metrics we can use the data for is the aggregate exposure to the equity market of the household sector. In the charts below, we show the percentage of total assets and financial assets that households have put in the equity market, either via direct holdings of stocks or exposure to stocks via mutual fund ownership.
In the first chart, we show these data for the combined household and nonprofit sector. Data specific to the household sector only doesn’t go back as far, but the two different flavors of household equity exposure tell the same tale: households are highly exposed to stocks, with a record share of their financial assets and total assets sitting in the equity market at current market values. Click here to view Bespoke’s premium membership options.

June 11th Memory Lane
As the S&P 500 continues to trade in a relatively sideways range with a slow drift higher, we thought it would be interesting to look at years where the market saw its largest single-day gains and losses on this date in history.
Starting off with the bad, you don’t have to go back too far to find the worst June 11th for the S&P 500 as it was only last year. After a nearly three-month rally off the March 2020 COVID lows, stocks were already starting to tread water, but on 6/11, the sellers won out as investors were forced to face reality. The sell-off came one day after Federal Reserve Chairman Jerome Powell highlighted the difficulties facing the American economy, saying that “the pace of recovery remains extraordinarily uncertain.” These cautious comments as well as an escalation in coronavirus infections in the southern part of the United States brought into focus the precariousness of the situation of the time and that the reopening process would not be as smooth as investors once thought. In addition, a number of political polls showed then President Donald Trump falling further behind in polls.
By the time the bell closed last year on June 11th, the VIX surged nearly 50% and closed above 40 as the S&P 500 fell 5.89%. Reopening stocks in the travel/leisure, financial, energy, and industrials sectors fell the most, but no area of the market avoided the selling stampede, as Kroger (KR) was the only stock in the S&P 500 to finish the day higher. Last June 11th no doubt caused a lot of stress for investors at the time, but looking at the move from a longer-term perspective, it was little more than a speed bump on the road to recovery.

In contrast to last year’s June 11th plunge, the best June 11th for US stocks was more than 80 years ago in 1940. Europe was already embroiled in war and things escalated when Italy joined the war effort of the Germans by declaring war on the French and attacking a British naval base in Malta. Despite the escalation of conflict, the market confidently rallied anyway. The reason? For starters, it was coming off a major plunge in May following the German attack of France and other areas of Western Europe. Besides being extremely oversold, another catalyst for the rally was an address by President Roosevelt at the University of Virginia commencement which has come to be known as the “Knife in the Back” speech. In that speech, FDR ditched his prepared comments and instead called for an end to the United States’ isolationism in response to Italy’s actions. He commented that “On this tenth day of June, 1940, the hand that held the dagger has struck it into the back of its neighbor.”
FDR went on to stress that the US couldn’t’ continue its isolationist policy:
“Some indeed still hold to the now somewhat obvious delusion that we of the United States can safely permit the United States to become a lone island, a lone island in a world dominated by the philosophy of force.”
In reaction to FDR’s speech, the feeling on Wall Street was that the US would take on a more active role in the war effort which caused a surge in industrial, defense, and material companies that would benefit from the Allied war effort. The impact of FDR’s speech was so strong that not only did US equities surge nearly 5% on that day in 1940, but the record June 12th gain was also the following day. Again, though, the gains on 6/11 and 6/12, 1940 came following a 25%+ plunge in less than two weeks, a decline rivaling the COVID plunge in terms of both duration and magnitude. Like the rally off the COVID lows, the equity market rallied sharply in the following weeks regaining more than three-quarters of its May decline over the following six months, but unlike the current period, the gains were fleeting as uncertainty over the war continued to act as a headwind.

Lastly, with inflation such a hot topic these days, we thought it would be fun to highlight some prices of goods in a number of ads we came across from the New York Times on that day in 1940. Read them and weep. Manhattan cocktails for a quarter ($4.81 in today’s dollars), dress shirts for under 2 bucks ($36 in today’s dollars), a new fridge for under $115 ($2,200 in today’s dollars), and a funeral for $150 ($2,885 in today’s dollars)? A dignified funeral no less! While prices are a lot higher now than they were then, so is the stock market. Back in June 1940, the S&P was under 10. Today, it’s 42,000% higher. Click here to view all of Bespoke’s premium membership options.

Bespoke’s Morning Lineup – 6/11/21 – Going Out on a High Note
See what’s driving market performance around the world in today’s Morning Lineup. Bespoke’s Morning Lineup is the best way to start your trading day. Read it now by starting a two-week free trial to Bespoke Premium. CLICK HERE to learn more and start your free trial.
“Americans are getting stronger. Twenty years ago, it took two people to carry ten dollars’ worth of groceries. Today, a five-year-old can do it.” – Henny Youngman
Equities are looking to close out the week on a positive note today as futures have been steadily drifting higher all morning. The economic calendar is light today with Michigan Confidence the only report on the calendar. One aspect of that report that investors will be watching is inflation expectations. Any material increase in those readings could pose a threat to the positive early tone. The latest readings on inflation expectations in this report were 4.6% for the next year and 3.0% over the next 5-10 years.
Read today’s Morning Lineup for a recap of all the major market news and events, the latest economic news from around the world overnight, and the latest US and international COVID trends including our vaccination trackers, and much more.

The market certainly took yesterday’s high CPI reading in stride. On the one hand, looking back at the last 35+ years, there have been a number of other periods where headline CPI temporarily eclipsed 0.5%. Unique about the current period, however, is that May’s report was the third straight month that prices increased 0.5%+ on a month over month basis. We don’t see that happen too often.

Since 1985, there have been just three other periods where headline CPI jumped 0.5% three months in a row, and in none of those prior periods did the streak extend to a fourth month. In the chart below, we show the 10-year US Treasury yield going back to 1985 and have marked each of the three-month streaks where CPI topped 0.5% in red. In two of the three periods (1990 and 2008), that surge in inflation marked the peak of the 10-year yield for at least the next year. In the third (2005), yields kept rising over the following year increasing from a level of about 4.3% up to 5.3% nine months later.

Bespoke’s Weekly Sector Snapshot — 6/10/21
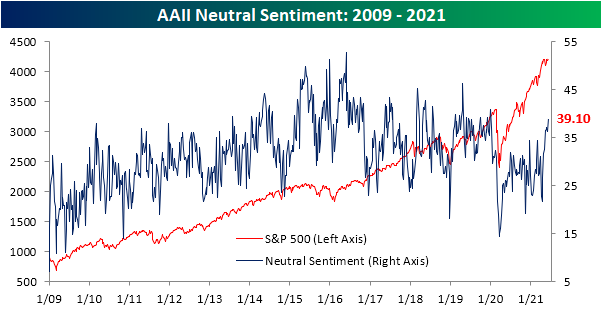
Neutral Sentiment Still On The Rise
After a sharp 7.7 percentage point rise last week, bullish sentiment as measured by the American Association of Individual Investors (AAII) weekly survey pulled back this week falling to 40.2%. While lower, that is still a few percentage points above the levels observed throughout most of May and is roughly 2 percentage points above the historical average of 38.03%. From a contrarian perspective, the more modest readings on sentiment recently are a welcome change from the elevated readings seen earlier this spring and in the winter.

Bearish sentiment tipped back above 20% this week, though, that is still a muted reading in the bottom 5% of the past decade’s range. In fact, the current level of bearish sentiment is around 10 percentage points lower than the historical average of 30.5%. Looking at another sentiment reading, the Investor’s Intelligence survey of newsletter writers saw bearish sentiment fall to 16.2% which is the lowest level since September.

That means sentiment continues to largely favor the bulls, but the drop in bullish sentiment was not matched by an equivalent rise in bearish sentiment. Instead, the bulk of those losses went into the neutral camp. The percentage of investors reporting as neutral has continued to climb reaching 39.1% this week. As has been the case consistently over the past month, that is the highest level in neutral sentiment since the first few weeks of January 2020 when over 40% of respondents reported as such. Click here to view all of Bespoke’s premium membership options.
Continuing Claims Finally Improve
Initial jobless claims were expected to fall another 15K this week as forecasts were calling for a reading of 370K. While claims did not live up to those expectations, they did make another move lower falling 9K to 376K. That is now just 120K above the levels from last March, right before claims began to print in the millions.
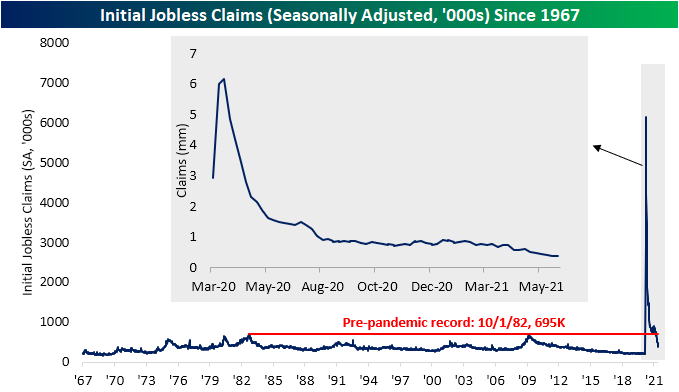
WIth another sequential decline, seasonally adjusted claims have now fallen for six weeks in a row. That is about half of the record streak of 13 weeks long that ended in early July of last year. Outside of that streak, there have only been six other streaks as long as the current one and only two of those, one in 1980 and the other in 2013, went on for seven weeks.

Those improvements in initial claims were shared on a non-seasonally adjusted basis. Claims from regular state programs fell below 400K for the first time since last year reaching 367.1K. Pandemic Unemployment Assistance (PUA) also set a new low with claims totaling just 71.29K; down only about 2K from the prior week. Although that was a minuscule improvement, the PUA program has massively been unwound over the past few months as we close in on the end dates for the program in half of US states. In fact, this week will mark the exit of the program for Alaska, Iowa, Mississippi, and Missouri. In the most recent week’s data, these four states accounted for 1.7K initial PUA claims and 72.3K continuing PUA claims, or 2.5% and 1.14%, respectively, of PUA claims nationally.

Since the start of the year, the improvements in continuing claims had been decelerating, coming to a head over the past couple of months with multiple upticks. This week offered a sigh of relief as claims fell 258K to 3.499 million. That was not only the biggest one-week drop since March 12th’s 282K decline, but it also brings claims to the lowest level since the week of March 20th last year.

On a non-seasonally adjusted basis and factoring in all other programs (which creates another week’s lag), the picture has been generally more positive. The most recent week’s data through May 21st showed total claims across all programs fell from 15.473 million to 15.376 million, the lowest level of the pandemic. A small uptick in claims from regular state programs was offset by sizable drops in PUA, PEUC, and Extended Benefit claims. Click here to view all of Bespoke’s premium membership options.

Chart of the Day: Wafer Wave Lifts AMAT
Energy Stocks Have a Long Way to Go
The S&P 500 Energy sector is by far the best performing sector year-to-date with a gain of 45.2% through yesterday. As shown below, Energy is outperforming the S&P 500 by roughly 33 percentage points so far in 2021.

Given its huge outperformance so far this year, it’s pretty remarkable that Energy is still lagging the S&P 500 over the last 12 months. As shown below, Energy is only up 22.8% year-over-year versus the S&P 500’s gain of 31.6%.

And longer-term, Energy’s performance on an absolute basis and relative to the S&P 500 remains horrible. Over the last 5 years, the Energy sector is down 18.7% versus the S&P 500’s gain of 99.5%.

Over the last 10 years, Energy is down 24.9% versus the S&P 500’s gain of 227.4%!

It’s not until we go back 20 years that Energy gets back into the green. Since June 2001, Energy is up 69.4% while the S&P 500 is up 233.6%.
Energy has finally experienced some outperformance versus the broad market in 2021, but its 45% gain year-to-date hardly makes up any ground when looking at the sector’s performance in the 2010s. The sector still has a LOT of catching up to do. Click here to view Bespoke’s premium membership options and sign up for a trial.
