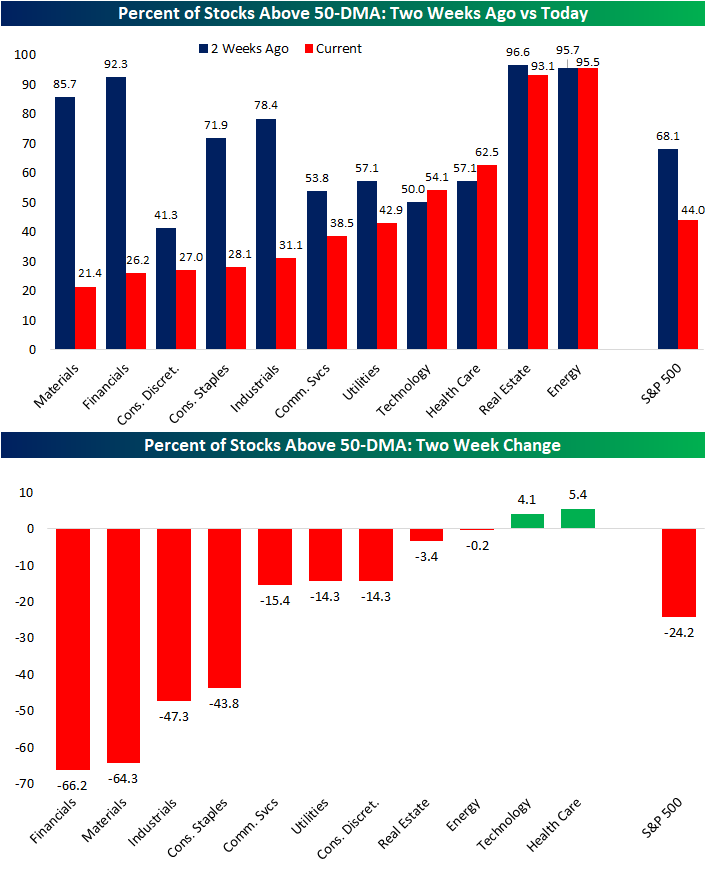
Big Drops In The Percent of Stocks Above Their 50-DMAs
In yesterday’s Sector Snapshot, we highlighted how the internals of several sectors have weakened dramatically in recent days. One such measure in which there are drastic differences versus a couple of weeks ago is the reading on the percentage of stocks above their 50-DMAs. In the charts below, we show the changes in this reading across sectors and for the broader S&P 500.
As shown, the two sectors which have seen the largest share of their stocks fall below the support of their 50-DMAs are Financials and Materials. Two weeks ago, both of these sectors boasted some of the strongest readings of all sectors, but through yesterday, those readings have fallen over 60 percentage points. Meanwhile, Energy and Real Estate have seen almost all of their stocks trade above their 50-DMAs over the past two weeks without much change. While the declines were not as dramatic as Materials and Financials, Industrials and Consumer Staples have also seen a significant share of their members fall below their 50-DMAs. While most sectors have seen a decline in this reading, Tech and Health Care have been notable standouts with both sectors having more stocks above their 50-DMAs now than two weeks ago. This is indicative of the rotation that has been going on underneath the surface throughout the entire bull market that began when the S&P made its 2020 low after the COVID Crash last March. Click here to view Bespoke’s premium membership options.
Bespoke Briefs — Treasury Auctions
Bespoke’s Morning Lineup – 6/18/21 – Down into the Weekend
See what’s driving market performance around the world in today’s Morning Lineup. Bespoke’s Morning Lineup is the best way to start your trading day. Read it now by starting a two-week free trial to Bespoke Premium. CLICK HERE to learn more and start your free trial.
“I think it’s natural we’ve tilted a little bit hawkish.” – James Bullard
So much for a quiet summer Friday. While futures were already lower, a CNBC interview with St Louis Fed President James Bullard (non-voter) where he had some relatively hawkish comments has only caused the losses to snowball. The S&P 500 is now on pace to open down about 1%. Today is an options expiration day with an unusually large amount of contracts expiring so that coupled with the fact that it’s now a Federal Holiday (Juneteenth) where volumes will likely be low, may only add to any potential volatility.
Read today’s Morning Lineup for a recap of all the major market news and events, the latest economic news from around the world overnight, a discussion of the latest delta COVID variant, the post-FOMC moves in markets, and the latest US and international COVID trends including our vaccination trackers, and much more.

We’ve seen quite a divergent move in the growth and value spaces over the last two days. While the S&P 500 Growth index closed at an all-time high, its Value counterpart has been subjected to selling pressure. As a result, the performance gap between the two indices over the last two trading days has shot up to 2.64 percentage points. That may sound like a relatively wide gap, but relative to the last year, it’s not all that extreme. Back in January, we saw a wider performance gap, and last year we saw numerous two-day periods where the two-day gap widened out more.

Memory Lane: June 18th
The S&P 500 is poised to open down about 1% this morning, but in order for today’s weakness to get anywhere near record territory for this day of the year (6/18/1930), it would need to drop a lot more from the open to close.
While most extreme market days have a clear catalyst behind them, others don’t. June 18th, 1930 (-3.50%) was the worst June 18th in the S&P’s history but a decline that came with little in the way of a concrete catalyst. With the market still in a tenuous position following the Black Tuesday crash, June 18th was a day of heavy volume where blue-chip stocks suffered some of the largest losses Selling reached a climax in the morning with shares of well known “glamour stocks” like Gillette, Mack Trucks, and Sears Roebuck trading below the levels they traded at on Black Tuesday.
After a lull in the volume in the mid-day, equities rebounded in the afternoon, but the damage was still done as a blue-chip stock like Eastman Kodakdropped 8.2%. Although the Dow and S&P did not make new lows relative to the lows in 1929, several key stocks exhibited negative divergences and took out their Black Tuesday lows. With a lack of a precise source for the erratic price action, it was thought that a combination of a negative “loadings of railway freight” report and seasonally low steel production contributed to a belief that hopes for recovery were premature, and rational investors, therefore raised cash. The downward slide in stocks would continue until 1932, where the market would reach its lowest level of the 20th century and lose an additional 70% of its value.

54 years later on June 18th, 1984, the S&P 500 jumped 1.81% with the rally ascribed to bargain hunters and short covering. In the grand scheme of things, most one-day rallies of 1.8% don’t burn themselves into your permanent memory bank, but June is not known for being a particularly volatile month. Heading into this day in 1984, market participants were still licking their wounds from the previous week’s rate-induced beatdown that was part of a broader sell-off that has been in place since late 1983. Some weaker economic data, though, raised hopes that the Fed would actually loosen policy, and that’s all it took for big buyers, including Salomon and other institutions, to step in and do some bargain hunting. The uptick in institutional activity showed itself as the number of large block trades (10,000+ shares) increased from 1,558 the prior day to 1,668.
In the weeks that followed June 18, 1984, the S&P 500 continued to drift lower, but by late July, the lows were in. From there, the S&P 500 never looked back and hasn’t traded at those levels again since. Click here to view Bespoke’s premium membership options.

Bespoke’s Weekly Sector Snapshot — 6/17/21
The Bespoke 50 Top Growth Stocks – 6/17/21
ARK Innovation (ARKK) Pummels Value (IVE)
The ARK Innovation ETF (ARKK) got a strong start out the gate this year and was up over 25% YTD at its high on February 12th. Since then the high flying momentum ETF has seen that strong performance wane as it currently sits on a 5% loss year to date. That is also not to say ARKK hasn’t rallied off of its recent lows. ARKK bottomed just over a month ago and has gone on to rally 17.5% since then. Today alone it is up 3.2%. While this momentum trade is bouncing back after a string of weakness, the opposite is true for value. The iShares S&P 500 Value ETF (IVE) has been on a steady rise higher all year and it is currently up 14.26% YTD, but that uptrend is now at risk as the ETF has reversed lower this month. Today the ETF is down 1.3%, and when compared to ARKK, it is a historically wide divergence in the two ETFs’ daily performance. In fact, the spread between the daily performance of ARKK and IVE is currently 4.55 percentage points. That is the tenth highest level on record with the most recent higher reading being in March of this year. Click here to view Bespoke’s premium membership options.

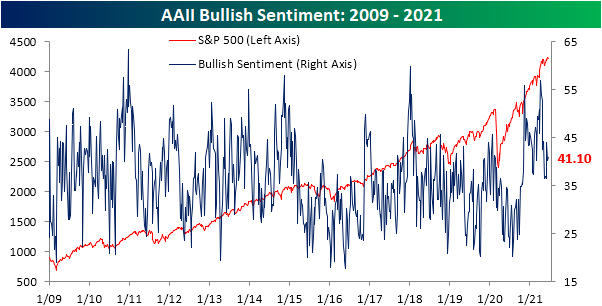
Sentiment Shaky
Although there has not been any sort of dramatic breakout to the upside as the index has fallen over the past few days, the S&P 500 did manage to tag new record highs in the past week for the first time since May 10th. The record-high milestone has done little to shift sentiment though. The AAII survey of individual investor sentiment saw its reading on bullish sentiment rise 0.9 percentage points to 41.1%. While higher, that is still three points below the reading from just a couple of weeks ago.
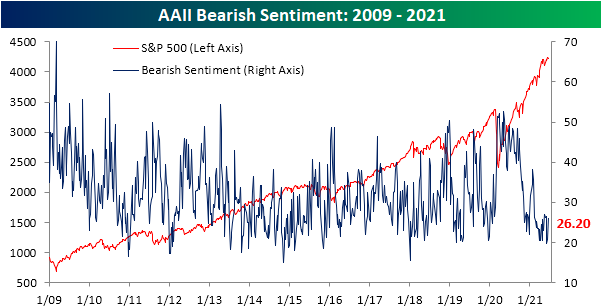
The biggest move was in neutral sentiment as that reading fell 6.4 percentage points to 32.7%. That is the lowest reading in over a month and marked the biggest drop in neutral sentiment since the week of April 8th. Even though that was a big drop, neutral sentiment remains slightly elevated versus the historical average (31.42%) and especially relative to what has been the norm over the past year.

The past couple of weeks have seen historically muted readings on bearish sentiment. While that is still the case with this week’s readings remaining at the low end of its historical range, bearish sentiment saw a big 5.5 percentage point gain rising to 26.2%. That one-week uptick in bearish sentiment was the largest since last September. It also marked the first time since the end of last month that over a quarter of respondents reported as bearish. While the move was not nearly as large, the Investors Intelligence survey echoed that increase in bearish sentiment with the bull-bear spread in that survey falling from 38.3 to 37.8 after inverse moves in bullish and bearish sentiment. In other words, broadly speaking, optimism has appeared to have peaked for the time being. Click here to view all of Bespoke’s membership options.
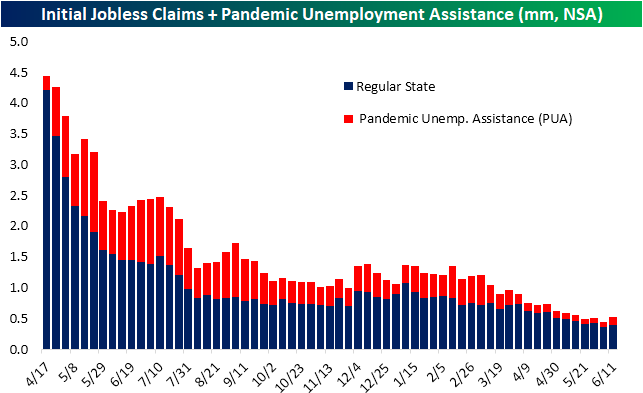
Claims Rise But The Trend Remains
Initial jobless claims were forecasted to extend the streak of consecutive declines to seven this week with a 16K decline penciled in. Instead, claims unexpectedly rose by 36K to 412K. Not only did this end a six-week streak of declines, but it was also the largest one-week increase since the last week of March bringing claims to the highest level in a month. While higher sequentially, the overall trend of lower claims remains in place.
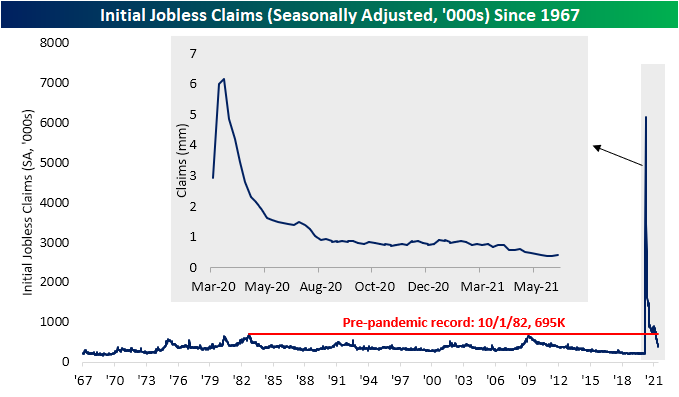
On a non-seasonally adjusted basis, regular state claims likewise rose back above 400K this week, although it was still one of the lowest readings of the pandemic. PUA claims were also higher with the national total rising to 118K from 71.3K last week. That increase comes in spite of the upcoming exit from the program by half of the country over the next month. On a state level, the main contributors to that increase in PUA claims were Maryland (+17.89K), Kentucky (+8.59K), Illinois (+5.46K), and California (+5.26K). Maryland interestingly is the only one of these states withdrawing from the pandemic era programs prior to the federal deadline of September. The state is currently scheduled to end support of the program in early July.
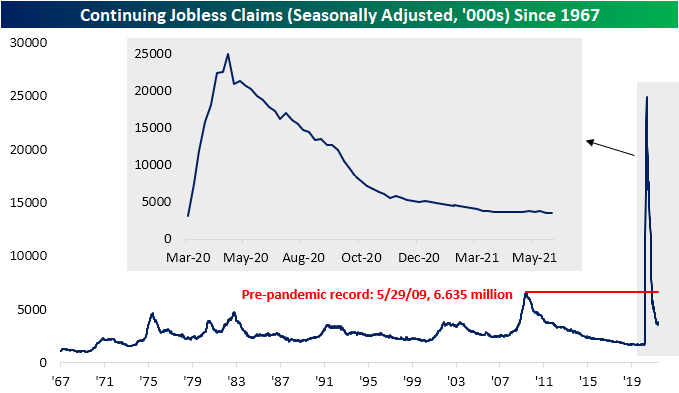
Following a substantial decline last week, continuing claims were relatively flat in the most recent week’s data. Nationally, continuing claims rose 1K to 3.518 million for the first week of June.
Looking at the data on a non-seasonally adjusted basis and including all programs adds another week’s lag to the data making the most recent print through the last week of May. Total claims across all programs have continued to fall, dipping below 15K for the first time in the most recent week’s data. A 253.9K drop in PUA claims was the biggest contributor to that decline while regular state, extended benefits, and PEUC programs also all fell significantly. Click here to view all of Bespoke’s membership options.

