Tech Earnings on Tap
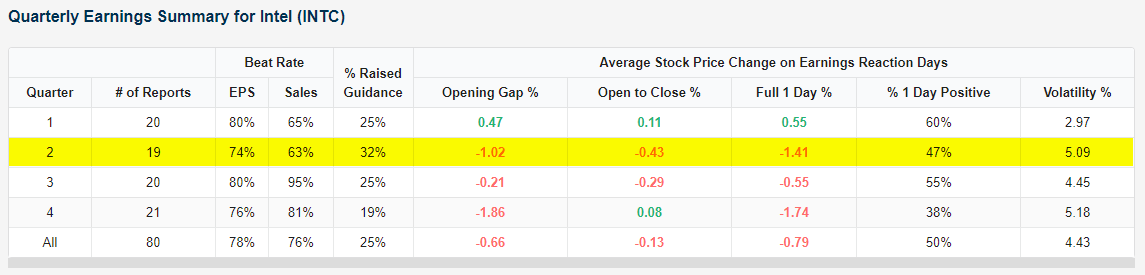
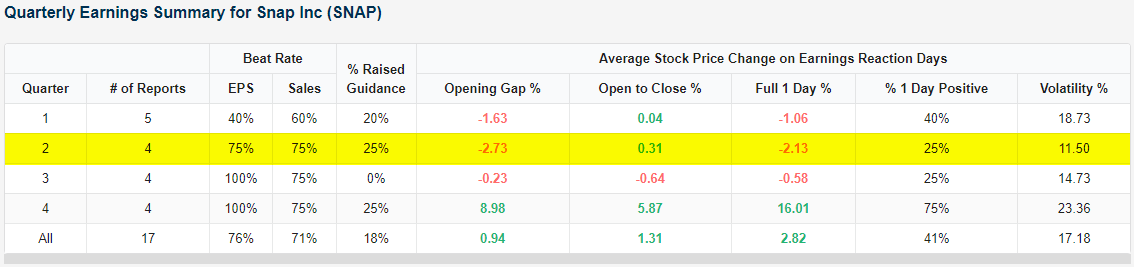
While there aren’t a lot of earnings reports on tap after the close today, there will be some notable reports from Intel (INTC), Snap (SNAP), and Twitter (TWTR). Investors have plenty of reasons to be bullish or bearish on these companies ahead of earnings, but we thought we’d provide a brief snapshot of how each stock has typically reacted to earnings reports in the past on both an overall basis and broken out by earnings seasons. The snapshots below are from our Earnings Explorer tool and show a breakdown of how often each stock exceeds EPS and revenue estimates as well as the percentage of time each one raises guidance. In addition, we then show how each stock has historically reacted to its earnings report on the first trading day after the report, and we break that performance out based on the average opening gap, the change from the open to close, the full-day return, and volatility (absolute average percent change on the day).
Starting with INTC, historically the stock has topped EPS forecasts 78% of the time, exceeded sales forecasts 76% of the time, and raised guidance 25% of the time. In the Q2 earnings season, the company’s EPS and sales beat rates are both less than average, but the company has raised guidance more often in the current earnings season than any other quarter. In terms of stock price performance, INTC typically doesn’t react particularly well to its earnings reports. For all of its earnings reports over the last 20 years, INTC has only risen on its earnings reaction day half of the time for an average one-day decline of 0.79%. In the Q2 earnings season specifically, INTC has been even weaker with an average one-day decline of 1.41%. When it comes to earnings, the only earnings season where the stock has reacted positively to earnings more often than it has reacted negatively is during the Q1 earnings season (April reports). More recently, earnings reports haven’t been particularly friendly to INTC as the stock has declined on its earnings reaction day following four of the last five reports.
Snap (SNAP) has been public for less than five years, and its earnings track record has been mixed. While the stock’s average one-day reaction to earnings has been a gain of 2.82%, it has only posted positive returns in reaction to earnings 41% of the time. Q2 earnings season has been even tougher on SNAP stock as it has only risen in reaction to earnings following one of its four Q2 reports for an average decline of 2.13%. More recently, the stock has traded more positively to earnings with positive returns following four of its last five earnings reports. One thing you can count on when it comes to SNAP and earnings is the stock will be volatile. The stock’s average one-day reaction to earnings has been a move of +/- 17.2%.
Twitter (TWTR) has been public for nearly twice as long as SNAP, and even with a larger sample size, it hasn’t typically reacted well to earnings. Despite topping EPS and revenue estimates 80% of the time, SNAP’s average one-day reaction to earnings has been a decline of 2.94% with positive returns just 40% of the time. During the Q2 earnings season, TWTR’s EPS and revenue beat rates haven’t been as strong as the overall averages, and it shows in the stock’s average reaction to earnings. Of the seven Q2 earnings reports for TWTR, the stock’s average performance is a decline of 4.39% with gains just 43% of the time. The only quarter that has been weaker is the Q1 earnings season, and true to form, the stock dropped more than 15% on the day after its report back in April. You can track these stats for all of the stocks you follow using our Earnings Explorer tool. The Earnings Explorer is available with a Bespoke Institutional trial, which you can start today.

Bulls and Bears Dead Even
For the third week in a row, bullish sentiment has slid with this week’s reading from the AAII falling to 30.6%. With a cumulative 18-percentage point decline in that time, bullish sentiment is now at the lowest level since October 1st, 2020.

An identical share of respondents to the survey reported as bearish this week. That is only the 47th time in the survey’s history that an equal share reported as bullish and bearish with the most recent other occurrence being the end of October 2020. Now back above 30%, bearish sentiment is at the highest level since the first week of February which is also essentially right in line with the historical average for bearish sentiment (30.53%).

Identical readings in bullish and bearish sentiment means the spread between the two is at zero. As shown below, that is the first non-positive reading in the spread since the last week of January.

As previously mentioned, throughout the history of the AAII’s survey going back to the late 1980s, there have only been 47 instances of identical readings in bullish and bearish sentiment, or when the bull-bear spread equals zero, including the most recent instance. In the chart below we show the average performance of the S&P 500 over the next weeks and months following those instances. As shown, across the board the S&P 500 has tended to underperform the norm with the one-week and one-month periods averaging a decline. Again, while the gains are smaller than normal, the S&P 500 has at least been higher 71.7% of the time six months out and 84.4% of the time one year later.

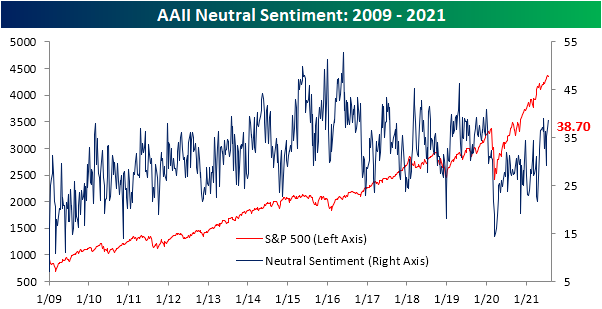
Not all of the losses to bullish sentiment turned bearish. Neutral sentiment rose 1.7 percentage points for a second week in a row. At 38.7%, neutral sentiment is at the highest level since June 10th.Click here to view Bespoke’s premium membership options.
The Bespoke 50 Top Growth Stocks — 7/22/21
Chart of the Day: Olympic Performance
State Withdrawals Show Face
Initial jobless claims were anticipating a 10K decline to 350K this week. Instead, claims rose back above 400K to reach the highest level since the week of May 14th. The 51K uptick to 419K this week was also the largest one-week increase since the final week of March. Not only was the most recent reading worse, but last week’s print was revised higher from 360K to 368K.
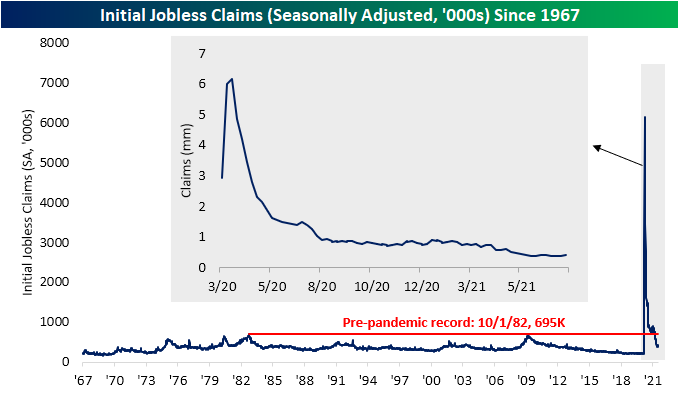
On a non-seasonally adjusted basis, it was a less dramatic increase with claims only rising 14.5K. Nonetheless, claims wound up above 400K. At 406.1K, it was the highest level in five weeks. Taking seasonality into account, NSA claims moving higher week over week during the current period of the year has historically been uncommon. Of all years since 1967, claims have only ticked higher during the current week of the year (29th week) 18.5% of the time.
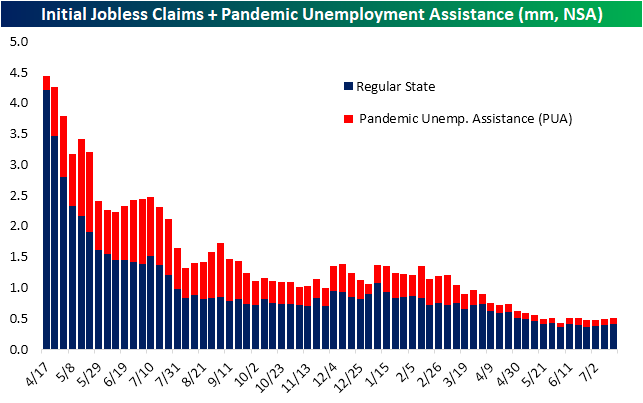
Regular state claims were not the only area of deterioration though. PUA claims had fallen back below 100K last week, but the most recent print rose to 110.3K. That made for the largest increase in initial PUA claims since the week of June 18th as total combined claims between regular state and PUA programs is at the highest level in two months. Delving deeper into the data though, more than half of the uptick in the national count of PUA claims was on account of a single state: Indiana. PUA claims for that state rose from zero to 7,598 after a judge ordered the program to be restarted.
Continuing claims through regular state programs were also weaker than expected coming in at 3.236 million versus forecasts of 3.1 million. Similar to initial claims, last week’s print was also revised higher by 24K. While expectations were calling for a larger decline and last week’s print was not as strong, adjusted continuing claims are still at the lowest level since last March.

Delayed an extra week, the inclusion of all other programs are finally clearly showing the withdrawal of states from pandemic era programs. Total claims for the first week of July fell to 12.59 million from 13.86 million. That 1.27 million drop in a single week was the largest since March 12th. Obviously, the bulk of those declines were on account of PUA and PEUC programs while Extended Benefits and regular state programs also saw significant declines.Click here to view Bespoke’s premium membership options.


Bespoke’s Morning Lineup – 7/22/21 – Small Caps Bounce Big
See what’s driving market performance around the world in today’s Morning Lineup. Bespoke’s Morning Lineup is the best way to start your trading day. Read it now by starting a two-week free trial to Bespoke Premium. CLICK HERE to learn more and start your free trial.
“If you don’t study any companies, you have the same success buying stocks as you do in a poker game if you bet without looking at your cards.” – Peter Lynch
The rally off of Monday afternoon’s low continues to roll on this morning as futures indicate modestly higher levels at the open. There’s quite a bit of economic data coming up throughout the morning, so that will impact prices in the short term. Jobless claims just came out and both initial and continuing claims came in well ahead of expectations. After the close, we’ll have a number of high-profile earnings reports from companies like Boston Beer (SAM), Capital One (COF), Intel (INTC), Snap (SNAP), and Twitter (TWTR).
Read today’s Morning Lineup for a recap of all the major market news and events from around the world, the latest US and international COVID trends including our vaccination trackers, and much more.

It’s been an eventful four days for the Russell 2000. With declines of 1.2% on Friday and another drop of 1.5% Monday, the Russell 2000 came roaring back on Tuesday by surging 3%, erasing all of the declines from the prior two days. On Wednesday, the small-cap benchmark followed up with an impressive encore by tacking on another 1.8%.
Despite all the fireworks lately, the moves in the Russell 2000 have been a lot of sound and fury signifying in particular. As shown in the chart below, the Russell 2000 has been stuck in a sideways trading range since the beginning of February. The key level to watch in the short-term for small caps is the 50-day moving average (DMA), which for the Russell 2000 ETF (IWM) stands at about $224.70. If the index can break that level to the upside, it would be an encouraging signal, while a test and failure to take out that level would suggest more rough sledding ahead.

Daily Sector Snapshot — 7/21/21
Bespoke Baskets Update — July 2021
Chart of the Day – After Hours vs Intraday Sector Performance
The US Is The Lone Overbought Country
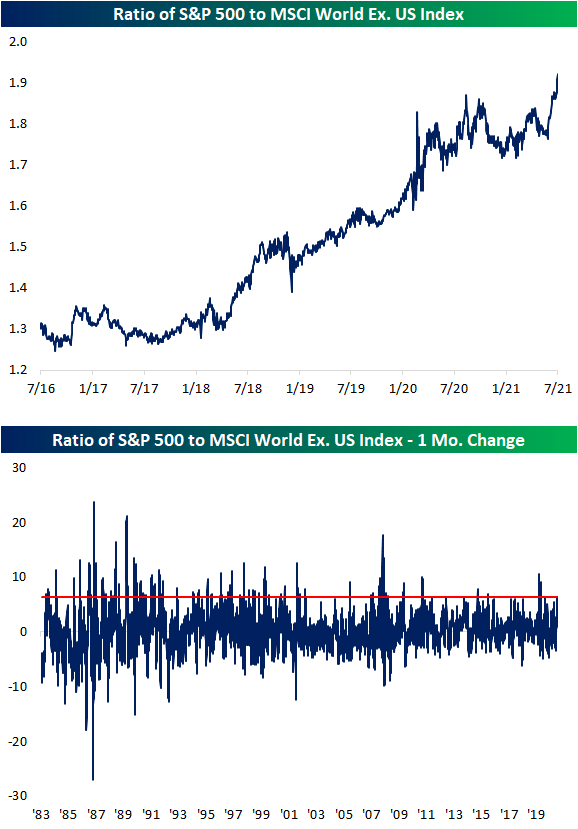
While the S&P 500 (SPY) may have had a string of weakness over the past week and a half resulting in a test of its 50-DMA, SPY has held up much better than many other major economies. Looking across the ETFs tracking the equity markets of each of the 23 major economies in or Global Macro Dashboard, the US, Switzerland (EWL), and Sweden (EWD) are the only countries that are up month to date with each country posting an over 1% gain. Conversely, China (MCHI) has been the worst performer having fallen 6.42% MTD. Additionally, alongside MCHI, Malaysia (EWM) and Japan (EWJ) are the only countries in the red year to date.
While EWD and EWL are up a similar amount to the US MTD, the US has been the only country of the 23 to have hit a 52-week high in July. Most of the rest of the world saw 52-week highs in the first days of June or earlier. In addition to the US being one of the only countries up on the month and recently putting in a 52-week high, the past couple of days’ rally off of the 50-DMA has resulted in the US returning back to overbought territory. By comparison, Switzerland (EWL) and Taiwan (EWT) are the only other ETFs that are even above their 50-DMA whereas 13 countries are oversold.

To show the outperformance of the US relative to other geographies, in the chart below, we show the ratio of the S&P 500 to the MSCI World Index that excludes the US. Since June, the ratio has taken off surpassing the highs from last summer in the process. In fact, the ratio has risen over 6% over the past month which stands in the top 5% of all monthly moves. That is the biggest one-month uptick in the ratio since it rose 9 percentage points last April. Prior to that, July 2016 was the last time in which the US has seen as large of a degree of outperformance. Click here to view Bespoke’s premium membership options.