BRICs Diverge, Japan (EWJ) Pullback, and Germany (EWG) Breakdown
Peering across the ETFs tracking the stock markets of the 23 global economies tracked in our Global Macro Dashboard, the US is far from alone in having declined recently. As shown in our matrix below, the US (SPY) hit its 52-week high back on September 2nd and only a handful of other countries hit their own 52-week highs after that date: Russia (RSX), Norway (ENOR), Japan (EW), and Taiwan (EWT). Russia is perhaps the most notable of these countries. Not only was it the ETF to have most recently hit a 52-week high, but it is also the only one that is currently above its levels from 9/2 and the only one that is trading over one standard deviation above its 50-DMA. In fact, RSX is teetering on extreme overbought territory. As for the other ETFs, Norway (ENOR), India (INDA), and Malaysia (EWM) are the only ones that are even above their 50-DMAs at the moment.
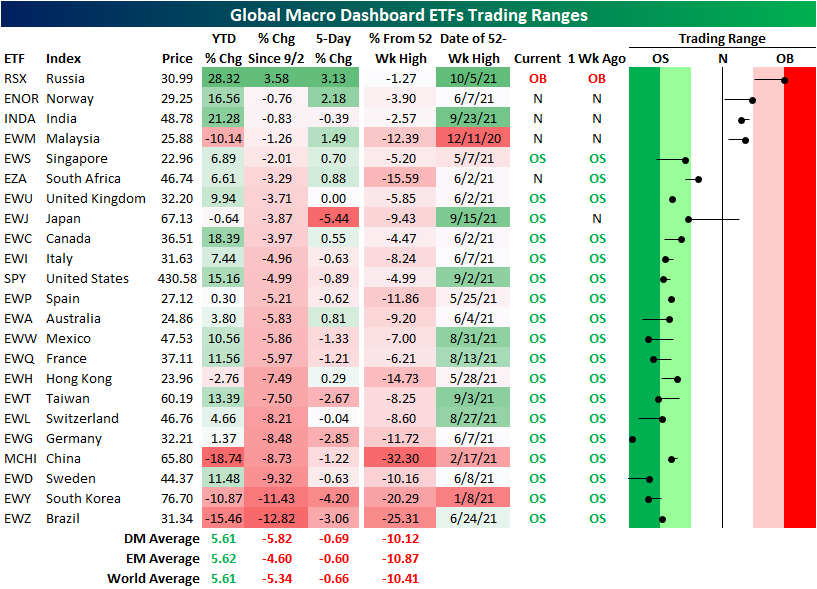
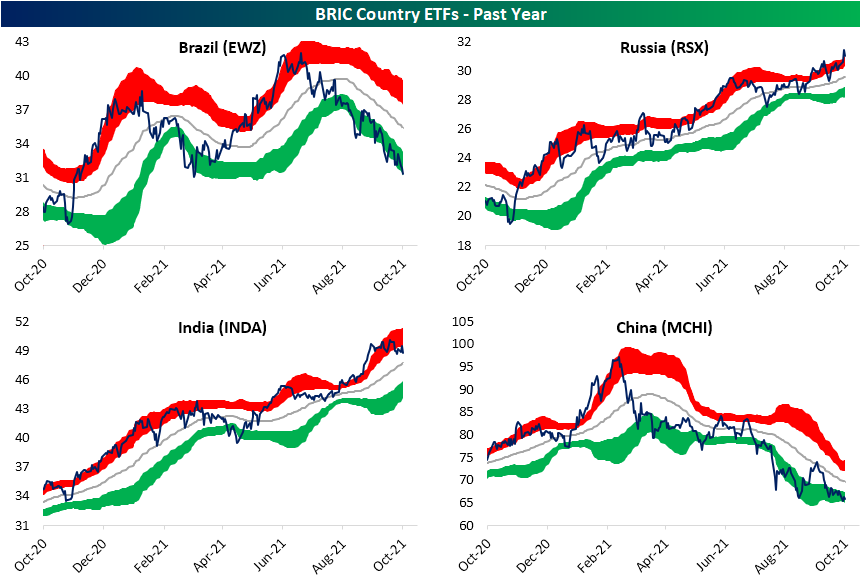
Again, Russia has experienced notable outperformance relative to most other country ETFs, but that is especially the case relative to other BRIC countries. Brazil (EWZ) and China (MCHI) have been in steady multi-month downtrends since their 52-week highs back in the first couple of months of the year. As a result of those downtrends, these two also have the worst YTD performance of all these country ETFs whereas RSX is the top performer followed by India (INDA). Additionally, since the US high on 9/2, Brazil has fallen 12.82% which ranks as the worst performance of any of these countries in that time frame. Only South Korea (EWY) has also fallen double digits in that same span of time. While it has also pulled back from its highs, the other BRIC country, India (INDA), is perhaps more similar to RSX with a steady uptrend over the past year. Currently, INDA is within 1% of its highs as well.
Pivoting away from EM markets, the G7 countries have broadly traded sideways over the past few months and are currently at the lower end of those ranges. There are exceptions to this though. Separating the downdraft over the past month, the US has actually trended higher since the spring. Germany (EWG) meanwhile is the only one that has totally broken down. In fact, it is currently the most oversold of all the 23 country ETFs highlighted above. With respect to its own history, the z-score readings (how many standard deviations from its 50-DMA the current price is) this month have all ranked in the bottom few percentiles of all periods since EWG began trading in 1996. Although EWG has broken down and is at the lowest level in months, Japan (EWJ) has experienced an even sharper short-term decline. In the past five days, EWJ has been the worst performer shedding 5.44%. EWJ has now erased all of the spike-up that occurred at the end of August through last month. If there is any silver lining to be found with regards to that decline, unlike EWG, Japan is for the time being above support at the summer lows. Click here to view Bespoke’s premium membership options.

Chart of the Day: Seasonal Volatility
Bespoke’s Morning Lineup – 10/6/21 – Ping Pong
See what’s driving market performance around the world in today’s Morning Lineup. Bespoke’s Morning Lineup is the best way to start your trading day. Read it now by starting a two-week trial to Bespoke Premium. CLICK HERE to learn more and start your trial.
“Blessed are the young for they shall inherit the national debt.” – Herbert Hoover
Futures are lower this morning as the S&P 500 is indicated to open down nearly 1% as the market swings back and forth between 1% daily gains and losses. One cited cause of today’s weakness is higher interest rates, but we would note that the yield on the 10-year is actually now down on the day and yesterday it was up 4 basis points (bps) and the market had no problem rallying.
In economic data today, the only report on the calendar was ADP Private Payrolls which handily topped estimated and gave a little bit of a lift to futures.
Read today’s Morning Lineup for a recap of all the major market news and events from around the world, including the latest US and international COVID trends.
If the declines we’re seeing in the futures do hold throughout the trading session it will not only be the fifth straight day with a 1%+ daily move, but it will also be the first time since March 2020 that SPY has alternated between 1% gains and losses for five trading days. If SPY does indeed fall 1% today, the current period will be just the second occurrence since SPY started trading in 1993. One key difference between now and March 2020, though, is that back then the daily moves were much larger and the five alternating days were also part of a 13 trading day stretch where the ETF experienced daily moves of 1%.

Start a two-week trial to Bespoke Premium and read today’s full Morning Lineup.
Daily Sector Snapshot — 10/5/21
FANG+ Bounce Back
Facebook (FB) remains in the news today as former employee Frances Haugen testifies before a Senate panel. The stock is bouncing back a bit after steep declines yesterday that came on the same day that most of the company’s websites and apps went dark for hours on end. That goes for the rest of the FANG cohort as well. As shown below, the NYSE FANG+ Index closed below its 200-DMA for the first time in 378 trading days yesterday. While it has not recovered all of yesterday’s losses with an inside day, the group is bouncing back significantly. In the process, the FANG+ Index has moved back above its 200-DMA.
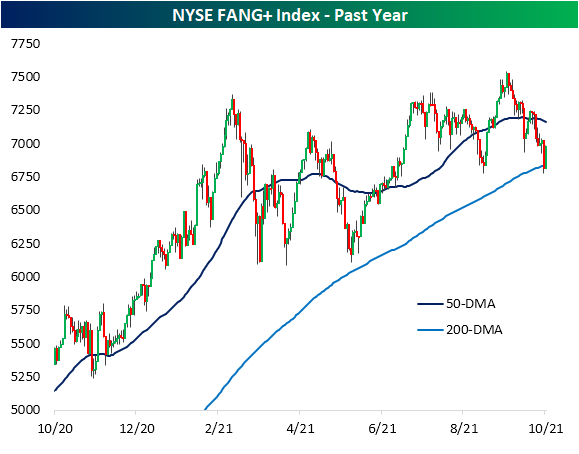
Amazon (AMZN) and Facebook (FB) are similarly seeing inside days today recovering some of yesterday’s declines. For AMZN, the bounce comes around support at the low end of the past year’s range. Meanwhile, for FB, the bounce comes in a bit of no man’s land in the middle of the range between its 50 and 200-DMAs. Similarly, Apple (AAPL) and Alphabet (GOOGL) are also now trading in between their 50 and 200-DMAs. Click here to view Bespoke’s premium membership options.

B.I.G. Tips – Q3 Earnings Season on Deck
Crude and Natural Gas Break Out
In an earlier post, we noted the long-term breakout of cotton futures in the context of what has been a historic short-term run. Elsewhere in the commodities space, there are other breakouts occurring today. As shown in the first chart below, crude oil took out its July intraday high of $76.98 yesterday and it has continued to move above those levels today. While crude oil is now within one dollar of $80, natural gas is also hitting a new high as the commodity continues to surge on supply concerns as we discussed in today’s Morning Lineup.

As both commodities rapidly trend higher, comparing the two, natural gas comes out as the clear winner recently. In the chart below we show the ratio of front-month crude oil futures to natural gas futures. When the line is rising, oil is outperforming natural gas. When the line is falling (as it is now), natural gas is outperforming oil. Since this past March, the ratio of the two has been in a steady decline and it is now at the lowest levels in a little under one year. Prior to that, the only lower readings in the ratio of the past five years was when crude prices went negative in April 2020 and in November 2018. Click here to view Bespoke’s premium membership options.

Performance Through Q3 And its Impact on Q4 Performance
Every year, the makeup and number of sectors that outperform the S&P 500 changes. This year, four sectors (Energy, Financials, Real Estate, and Communication Services) outperformed the S&P 500 through the end of Q3, while last year it was only three sectors that outperformed in the first three quarters of the year (Technology, Consumer Discretionary, and Communication Services).
As we all know, past performance does not indicate future performance, and in looking at sectors that have outperformed the S&P 500 in the first three quarters of prior years compared to how they performed in Q4, the same holds true. The table below lists the number of sectors that outperformed and underperformed the S&P 500 in the first three quarters of each year since 2000 and then shows their median performance during Q4 of the same year. Looking at a summary of the annual results, it’s almost a coinflip as to whether or not the leading sectors in the first three quarters of a given year will continue to outperform in Q4. On average, the sectors that outperform YTD through 9/30 have averaged a Q4 gain of 3.58% (median: +6.40%) with positive returns 76% of the time. Sectors that lag the S&P 500 in the first three quarters of the year average a rest of year gain of 3.67% (median: 5.95%) with gains 71% of the time. While the term ‘strength begets strength’ has historically been applicable to the broader market, at the sector level, buying the YTD winners (or losers) ahead of Q4 in expectation of continued momentum to close out the year (or a mean reversion bounce) hasn’t offered any material outperformance. Click here to view Bespoke’s premium membership options.
