Chart of the Day: Presidential Approval & Performance Through Midterms
Pandemic Claims Still There
Rather than the expected decline to 320K this week, seasonally adjusted initial jobless claims rose to 351K (from weekly FRED data). That is the second week in a row that claims were higher and in which claims were worse than forecasts. After the past two weeks of increases, claims are also now at the highest level in a month, though, that is still near pandemic lows.

On a non-seasonally adjusted basis, claims were also higher rising by 40.3K week over week. That brings regular state claims back above 300K for the first time since the week of August 13th. Pandemic era programs technically ended in the first week of September and last week’s release was the first data point to capture this. PUA claims did drop substantially that week with an over 70K decline, but they did not fall to zero as one might expect. The same is the case this week with PUA claims falling further to a very low level of 15.16K. As for why PUA claim counts are still being recorded following the end of the program is not exactly clear, but it could be due to backdating of claims.

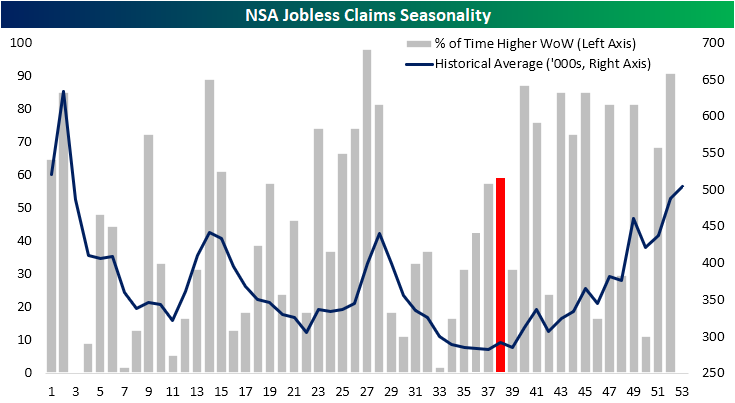
While PUA claims will likely continue to drop and become even less of a factor than is already the case, we are now past the point of the year in which claims have seasonal tailwinds. As shown below, on average claims historically rise from mid-September through the end of the year with week over week increases happening more than half the time. In other words, pandemic programs falling off have and will keep lowering claim counts but that will also be to some degree offset by seasonality.
Continuing claims are lagged an additional week to initial claims making the most recent data through the week of September 10th. Here too, claims saw a surprise uptick to 2.845 million versus expectations of a further decline to 2.6 million.

The inclusion of all programs adds yet another week’s lag to the data making the most recent data through the week of September 3; the last before the end of pandemic programs. Leading into the deadline for pandemic programs, total non-seasonally adjusted continuing claims fell to a fresh low of 11.26 million. PUA claims and PEUC claims were the biggest contributors to that decline as the former fell by 591K and the latter fell by 161K. Regular state claims also experienced a significant decline of 290K. As those programs all saw significant declines, that was offset by another sizeable increase in extended benefits programs although there is a caveat to that move.
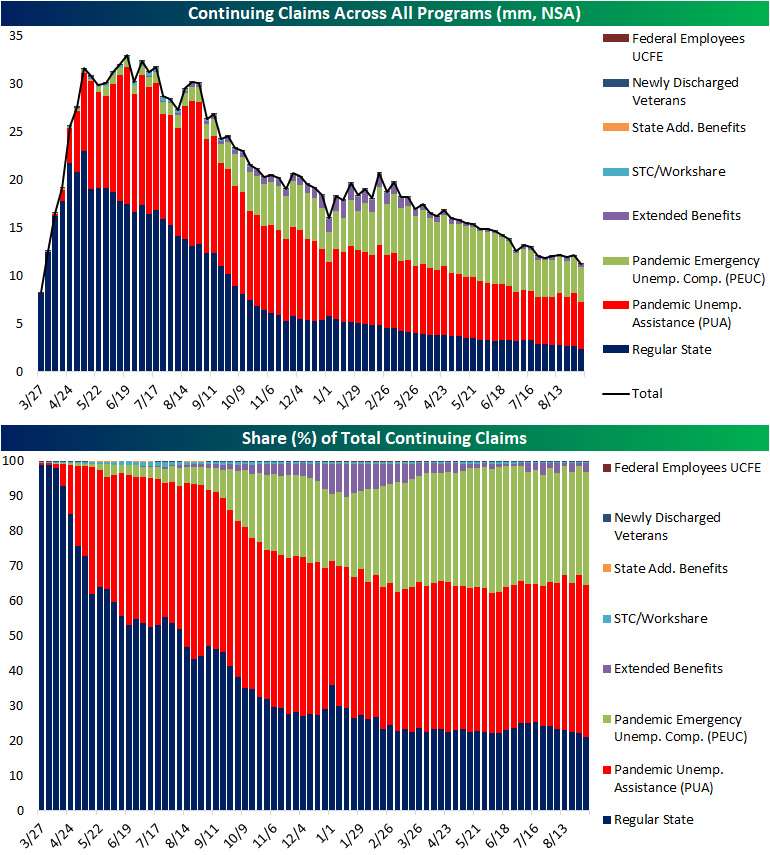
Over the past couple of months, we have frequently made note of the volatility in claim counts for extended benefits programs. Week to week this reading has been in a cycle of big increases followed by big drops. To quantify just how volatile it has been, in the second chart below we show the 8 week rolling average in the program’s absolute week-over-week change. That average not only surpassed last year’s highs but it hit a record last week, surpassing the prior high from after the Global Financial Crisis. Click here to view Bespoke’s premium membership options.

CPI vs Treasury and Dividend Yields
In order for an investor to generate real returns, the yield of an investment must exceed the going rate of inflation. Using the 10-Tear US Treasury Note as an example, if it yields 5% and inflation is running at 3%, an investor’s real yield would be 2%. The chart below shows the yield on the 10-year US Treasury along with Core CPI on a y/y basis going back 50 years. Throughout history, inflation and interest rates have tended to track each other over time, and most of the time, the 10-year yield exceeded the y/y rate of Core CPI. In fact, on a monthly basis, the 10-year yield has exceeded Core CPI more than 85% of the time. The shaded areas in the chart show periods where Core CPI was greater than the 10-year yield. Prior to the Financial Crisis, there were only two periods where it occurred, but since 2010, inflation has exceeded the 10-year yield much more frequently, although the current spread between Core CPI and the 10-year yield is the widest it has been since 1980. In other words, investors aren’t being compensated much for holding US Treasuries.

While it is relatively uncommon for Core CPI to exceed the yield on the 10-year, it is much more common for Core CPI to exceed the dividend yield of the S&P 500. Whereas Core CPI has exceeded the 10-year yield less than 13% of the time since 1971, it has exceeded the S&P 500’s dividend yield more than 75% of the time.

With Core CPI currently higher than both the 10-year yield and the S&P 500’s dividend yield, what does it mean for stock prices? There’s no way to be sure, but looking back over the last 50 years, stock prices have tended to trade relatively well during these periods. Going back on a monthly basis over the last 50 years, we calculated the S&P 500’s forward 12-month return following different scenarios in the relationship between Core CPI and yields on the 10-year US Treasury and the S&P 500. The first section of the table below shows S&P 500 average forward returns when CPI is higher than the 10-year yield or the S&P 500’s dividend yield. Below that, we show performance following periods when Core CPI was below either of those yields, and then lastly, given that Core CPI is above both the 10-year yield and the S&P 500’s dividend yield, the bottom section shows average forward equity market returns under that scenario.
As mentioned above, it’s not common for Core CPI to exceed the yield on the 10-year. While only 13% of months in the last 50 years have met that criteria, the S&P 500’s forward one-year performance was very strong, averaging a gain of 18.7% with positive returns nearly every time. In fact, the only time the S&P 500 had a negative 12-month return following a month that met this criteria was in the 12 months following 9/30/1980. When Core CPI has exceeded the S&P 500’s dividend yield, the S&P 500 was still positive over the next 12 months nearly three-quarters of the time, but the index’s average gain has been a more modest 7.8%.
In the opposite scenarios, when Core CPI is lower than the yield on the 10-year US Treasury, the S&P 500’s average 12-month forward return was a gain of 7.6% with positive returns 72.5% of the time. Performance is much better when Core CPI is lower than the S&P 500’s dividend yield. In the year following those occurrences, the S&P 500 averaged a gain of 13.6% with gains 87% of the time.
Lastly, scenarios like the current one where Core CPI is simultaneously higher than both the 10-year yield and the S&P 500’s dividend yield are very uncommon occurring in less than 10% of all months since 1970. Following those periods, the S&P 500’s average change over the next 12 months has been 15.8% with positive returns over 98% of the time.
While forward 12-month equity market returns have been positive when Core CPI is higher than the 10-year yield, these returns don’t take into account the impact of inflation. Real returns which we alluded to above will not be as strong, but the analysis does suggest that historically, equities have provided some degree of a hedge in a higher inflation environment.
As always, past performance is no guarantee of future results.

Bespoke’s Morning Lineup – 9/23/21 – Some Positive Follow Through
See what’s driving market performance around the world in today’s Morning Lineup. Bespoke’s Morning Lineup is the best way to start your trading day. Read it now by starting a two-week trial to Bespoke Premium. CLICK HERE to learn more and start your trial.
“And, you know, it tells a story of inflation expectations moving up.” – Jay Powell
If you’re feeling a little bit like Phil Connors from the movie Groundhog Day this morning, you’re not alone. For the third straight morning, futures on the Dow are trading higher by a bit over 200 points. Unlike Groundhog Day, though, the last two days ended in completely different ways. Whereas Tuesday’s early morning rally was Ned Ryerson-ed and reversed by the end of the day, yesterday, equities were able to build on the early gains before pulling back during Chair Powell’s press conference. Only time will tell what today’s session will have in store.
It’s a busy day for economic data this morning with the Chicago Fed National Activity Index, Jobless Claims, Leading Indicators, Flash PMIs, and the KC Fed Manufacturing report.
Read today’s Morning Lineup for a recap of all the major market news and events from around the world, including the latest US and international COVID trends.
Readings on inflation, and just as importantly, inflation expectations, have been some of the most closely scrutinized economic data points lately. One way to track what consumers are thinking about inflation is through their actions online and more specifically, their internet searches. Below we show Google Trends search history for the term ‘inflation” over the last five years. Earlier this year, as stimulus funds stoked consumer demand even as supply chains remained in flux, ‘inflation’ searches started to rapidly rise. They hit a five-year high in mid-February and didn’t stop there. By early May, searches for the term inflation were at the highest levels since at least 2004. Unfortunately, there was no Google in the 1970s! From the peak reading in early May, search interest for inflation started to slow but remained elevated throughout the peak summer months. More recently, though, search interest has kept declining, and while still high relative to pre-2021 history, there were periods prior to 2021 where search interest for the term was actually higher. If this more recent trend of declining search interest continues, it would further support the Fed’s forecast for recent inflation pressures to be ‘transitory’ in nature.

Start a two-week trial to Bespoke Premium and read today’s full Morning Lineup.
Daily Sector Snapshot — 9/22/21
IPO ETF Strong Recently
While the broader market has generally trended lower this month, one area of slight outperformance has been the stock market newbies. As shown below, whereas the S&P 500 (SPY) has fallen 2.88% MTD, the Renaissance IPO ETF (IPO) has risen 3.5%. At the moment, the IPO ETF is actually trading overbought (>1 standard deviation above its 50-DMA) while SPY began the day in oversold territory (>1 standard deviation below its 50-DMA).
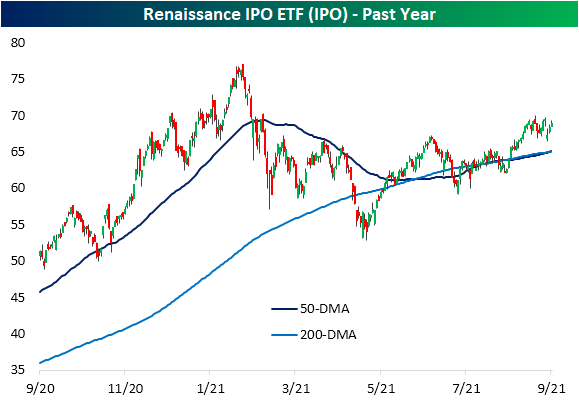
The move higher in the IPO ETF has resulted in the past year’s relative strength line versus the S&P 500 (SPY) to move back into positive territory and taking out the late June high as well. Positive readings and times when the line is trending higher indicate that IPO is outperforming the S&P 500 and vice versa for negative readings. Click here to view Bespoke’s premium membership options.

B.I.G. Tips – Weak Breadth
Bespoke’s Morning Lineup – 9/22/21 – Same Futures, Different Day
See what’s driving market performance around the world in today’s Morning Lineup. Bespoke’s Morning Lineup is the best way to start your trading day. Read it now by starting a two-week trial to Bespoke Premium. CLICK HERE to learn more and start your trial.
“We learn who we are in practice, not in theory.” – David Epstein – Range
After a day in which the S&P 500 finished trading right around the flatline after opening sharply higher, markets are doing a re-take today with futures higher by just about the same amount they were at this time yesterday. Unlike yesterday, though, investors will have to contend with a Fed policy statement, dot plots, and a press conference from Jerome Powell this afternoon. Powell pressers haven’t had a particularly positive impact on the market lately.
Outside the US, equities in Europe are higher across the board this morning, and the STOXX 600 is actually now flat on the week after gains yesterday and today have erased all of Monday’s drop. In China, equities finally opened for trading this week after a two-day mid-Autumn Festival holiday. While Chinese stocks opened the week lower, they rebounded throughout the day to finish down 0.70%. So, while Europe is flat and China is down less than 1% on the week, US stocks are down over 1.75%.
Read today’s Morning Lineup for a recap of all the major market news and events from around the world, including the latest US and international COVID trends.
Lately, it seems as though plenty of good arguments can be made for being long or short the US dollar. Given the strong feelings on both sides of the trade, it probably shouldn’t come as too much of a surprise that the Bloomberg US Dollar Index is currently trading right in the middle of its one year range around 1,150 and at a level it has had difficulty meaningfully breaking above throughout the year. Whichever way the greenback breaks from its most recent run to 1,150 will likely have a major impact on which sectors/strategies outperform through the end of the year.

Start a two-week trial to Bespoke Premium and read today’s full Morning Lineup.