The Bespoke Report – 10/8/21 – Sitting in Limbo
This week’s Bespoke Report newsletter is now available for members.
After some rocky trading to kick off the month, it was hard for many to believe that the S&P 500 was actually up over 2% in the first full week of October. Regardless of how it got there, a win is a win no matter how messy it was. Despite the rally to kick-off October, the S&P 500 finished the week right around 3% from its record closing high on September 2nd.
Some people reading this are enjoying a three-day weekend in observance of Columbus Day on Monday, but the market will be open on Monday, and investors will be looking for major US indices to show some signs of which way they plan to break out of the current state of limbo we find ourselves in heading into the weekend. Will earnings season be the catalyst to get stocks back to their recent highs, or will the fact that this week’s rally ran out of steam just shy of the 50-day moving average end up, in retrospect, being the beginning of a new leg lower?
In this week’s Bespoke Report, we’ll look to shed some light on these questions as well as recap some of the key trends facing the market. There are a ton of insights on both markets and the economy in this week’s newsletter, and you can read it now with a two-week trial to our subscription service — Bespoke Premium. Click here to learn more about Bespoke Premium and start a two-week trial if you’re interested.


Daily Sector Snapshot — 10/8/21
Intraday Commodity Spikes
Since the late spring, both silver and gold have been in steady downtrends spending much of that time below their 50-DMAs. Those downtrends remain in place, but both metals did find a short-term bottom on September 29th. While they have been rallying in the past week and a half, today each one has stalled out. From the early morning leading up to the Nonfarm Payrolls report, precious metals ramped higher with a surge immediately following the weaker than expected report. Only a couple hours after the release, gold and silver had erased a large portion of their earlier gains. In fact, silver is now 2.15% below its intraday high and gold is 1.36% below its high. For gold, in particular, that intraday reversal also marked a rejection of its 50-DMA which it—as well as silver—has struggled to stay above for most of the past several months.

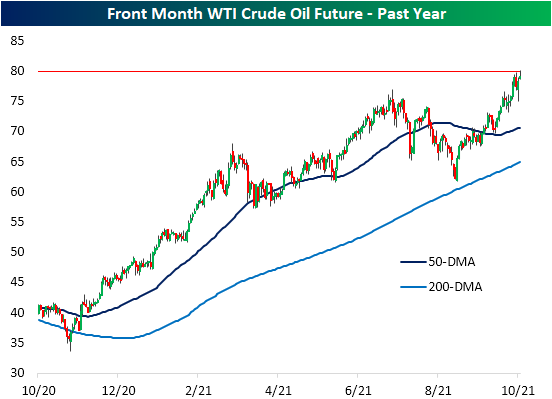
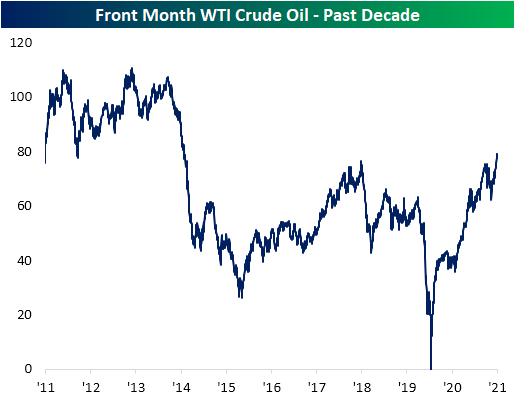
Crude oil is yet another commodity that is currently down off of its intraday highs, and like gold, the reversal came at a pretty interesting level. At its high Friday morning, front-month WTI futures rose above $80 for the first time since November 2014. Click here to view Bespoke’s premium membership options.
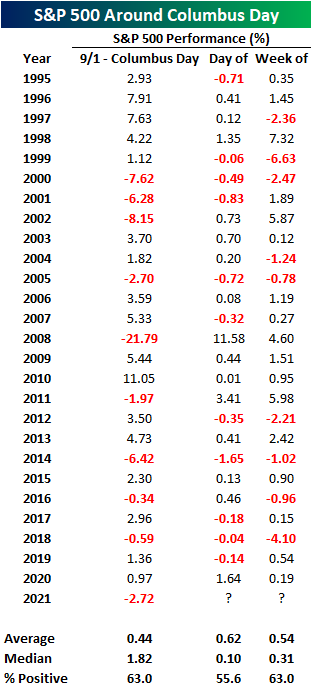
Columbus Day Performance
Columbus Day is an interesting trading day for financial markets as it is one of the few trading days of the year when the equity market is open, but the bond market is closed. This may lead investors to think that equity markets should perform positively, as investors do not have credit markets to allocate capital to on that specific day. However, looking at the S&P 500’s historical performance on Columbus Day over the last 25 years doesn’t necessarily show a real positive bias. Columbus Day tends to act just like any other trading day. Over the last 25 years, median performance on Columbus Day has been a gain of 10 basis points (bps) with positive returns 55.6% of the time. While that’s slightly higher than the median one-day gain of 7 bps for all trading days over the last 25 years, the difference isn’t significant. That’s not to say that Columbus Day hasn’t seen some outliers, though. Who can forget in 2008, during the middle of the Financial Crisis, when the S&P 500 rallied more than 11% on Columbus Day!
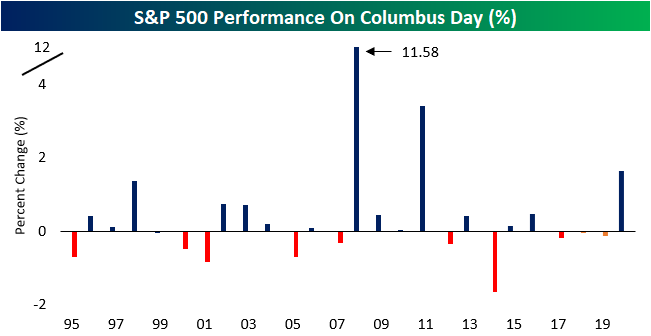
For the week of Columbus Day, the S&P 500’s median gain has been 0.31% with positive returns 63% of the time which also isn’t extraordinary relative to average weekly returns for the S&P 500 over the last 25 years. The worst Columbus Day weeks were in 1999 (-6.63%) and 2018 (-4.10%) while the best were in 1998 (+7.32%), 2002 (5.87%), and 2011 (+5.98%). Interestingly enough, in 2008, even after rallying over 11% on Columbus Day, the S&P 500 finished the week up just 4.60% as it erased more than half of its gains from the holiday session.

The table below lists the S&P 500’s performance leading up to and after Columbus Day for each of the last 25 years. With a decline of over 2.5% since the start of September, this year ranks as the weakest performance for the equity market since 2014. Click here to view Bespoke’s premium membership options.
Bespoke’s Morning Lineup – 10/8/21 – Jobs Day
See what’s driving market performance around the world in today’s Morning Lineup. Bespoke’s Morning Lineup is the best way to start your trading day. Read it now by starting a two-week trial to Bespoke Premium. CLICK HERE to learn more and start your trial.
“The greatest teacher I know is the job itself.” – James Cash Penney
Good Morning Subscriber,
It’s jobs Friday, and while there has been little movement in futures ahead of the report, there has been a modest drift higher as futures are indicating a slightly positive open. Treasury yields are higher in anticipation of a solid jobs report and rising bond yields in Europe. After the employment report, there’s little in the way of economic data, and with the bond market closed on Monday for Columbus Day, this afternoon could have the feel of a Summer Friday even if it is October.
Read today’s Morning Lineup for a recap of all the major market news and events from around the world, including the latest US and international COVID trends.
It hasn’t been a quiet start to October, but with the first full week of the month behind us, it’s been a positive start. The S&P 500 is up over 2%, and all eleven sectors are also to the north of unchanged. Not surprisingly, Energy has been the best performing sector month to date with a gain of over 5%, but Financials, Industrials, and Materials have also rallied more than 3%. Like Energy, the Financials sector is also at overbought levels, but Industrials and Materials are only just moving out of oversold levels. The only other sector even above its 50-day moving average is Consumer Discretionary.
You can look at the current setup in one of two ways. On the one hand, there is still a lot more room for upside before the market reaches short-term overbought levels. Then again, one could also argue that the equity market has a lot more to prove before we can say the pullback is over.

Start a two-week trial to Bespoke Premium and read today’s full Morning Lineup.
Bespoke’s Weekly Sector Snapshot — 10/7/21
The Bespoke 50 Growth Stocks – 10/7/21
Neutral Sentiment Grows
The S&P 500 has found some support in the past week but sentiment readings from AAII have not shown a major shift toward bullish sentiment. The percentage of respondents reporting as bullish this week fell for the second week in a row to 25.5%. That is still above the low of 22.4% from the week of 9/15.

Not only did bullish sentiment fall but so too did bearish sentiment. Whereas over 40% of respondents reported as bears last week, this week, the reading fell to 36.8%. That remains elevated relative to the past year, but it also marks the lowest level of bearish sentiment since September 9th.
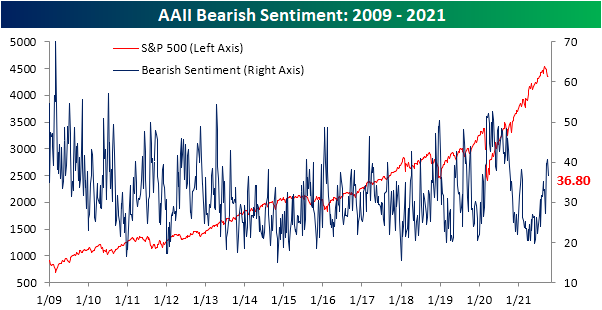
That means neutral sentiment saw a notable jump to 37.7% this week borrowing from the losses to the bullish and bearish camps. Since the start of the pandemic, this week’s reading ranks as the fifth-highest and is 6.3 percentage points above the historical average. That makes for the first time since the end of July that neutral sentiment was the predominant sentiment reading.

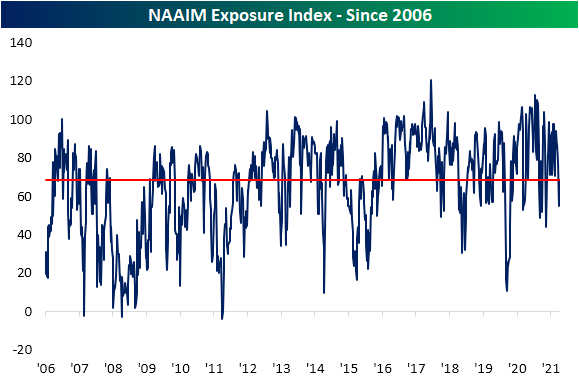
Apart from the AAII survey, the National Association of Active Investment Managers’ (NAAIM) Exposure Index also showed a reversal in pessimism this week. The index measures managers’ exposure to US equities. Readings of positive/negative 200 would indicate reporting managers are levered long/short, positive/negative 100 is fully long/short, and zero would be market neutral. Last week, this index hit a low of 55 which was the weakest reading since the spring. This week, we saw a modest bounce to 68.6. While improved, that is still below the spring and summer’s range. Click here to view Bespoke’s premium membership options.