Global Market Cap Distribution
According to Bloomberg market cap readings, as of yesterday’s close, the United States had a 44% share of aggregate global stock market cap; topping the next largest country, China, by a factor of over four. As shown below, the US has seen its share of world market cap increase by 2.84 percentage points so far in 2021, which is a huge gain. This shouldn’t come as too much of a surprise, though, given that the US has outperformed nearly every major country stock market this year. In terms of other countries that have seen an increase in share this year, China has increased by 0.38 percentage points, while India has increased by 0.42 percentage points. The two big losers this year have been Japan and Hong Kong, with each losing more than a percentage point of share. Members of the European Union have an aggregate share of 9.82%; less than a quarter of the share of the United States. All told, the top 20 countries hold 93.06% of global market cap, and the top five have a 68.70% share.
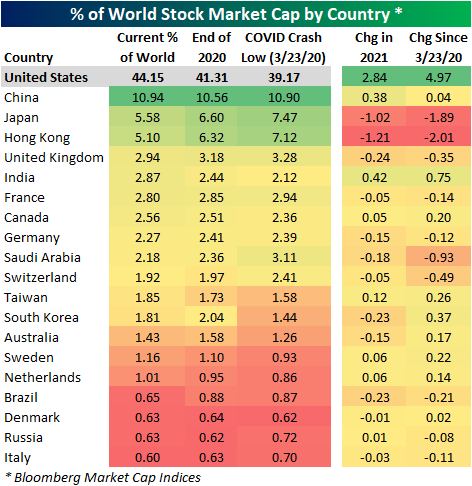
During the mid-2000s bull market leading up to the Global Financial Crisis, the US was consistently losing its share of global market cap to the rest of the world. From the end of the Dot Com Crash to the peak just before the Financial Crisis, the US lost more than 15 percentage points of share. That was a banner period for both emerging and developed markets outside of the US. Since 2009, though, the US has been steadily gaining ground with some acceleration in the past couple of years as US equities have generally outperformed the rest of the world. Notably, the COVID crash did not result in the US shedding any significant share of market cap seeing as the sell-off was a global affair. Instead, the US has seen its share increase nearly 5 percentage points since the COVID Crash low.
The US has been increasing its share versus the rest of the world for more than a decade now, and at some point one has to think this trend will reverse for a bit. International equity markets, especially emerging markets, have essentially gone nowhere versus their levels from the mid-2000s. There are plenty of investors out there that have taken on more and more exposure to international markets in recent years because of their relative weakness to the US, and so far nothing has materialized. Click here to view Bespoke’s premium membership options.

Bespoke’s Morning Lineup – 12/17/21 – Ending on a Down Note
See what’s driving market performance around the world in today’s Morning Lineup. Bespoke’s Morning Lineup is the best way to start your trading day. Read it now by starting a two-week trial to Bespoke Premium. CLICK HERE to learn more and start your trial.
“We must take the current when it serves, or lose our ventures.” – William Shakespeare
It’s red all over the screen this morning as equity futures, treasury yields, cryptocurrencies, and commodities are all lower. The only thing higher it seems is COVID case counts. Market sentiment certainly doesn’t feel jolly as Christmas is barely a week away. One positive trend worth noting, however, is that South Africa is reporting that the hospitalization rate for the latest Omicron wave of COVID has been much less than at the same point in the Delta wave, so hopefully, that’s a trend that continues over there and here in the US as the variant takes hold.
Read today’s Morning Lineup for a recap of all the major market news and events from around the world, including the latest US and international COVID trends.
The Nasdaq and Consumer Staples have followed divergent paths over the last month with the Nasdaq down close to 5% while Consumer Staples have rallied nearly 5%. With a performance spread of nearly 10 percentage points between the two, the gap is the widest in the Consumer Staples sector’s favor that it has been in since March of this year, and besides that the only other times in the last ten years that the spread got this wide were in August 2011, October 2018, and March 2020.

Start a two-week trial to Bespoke Premium to read today’s full Morning Lineup.
Bespoke’s Weekly Sector Snapshot — 12/16/21
The Bespoke 50 Growth Stocks – 12/16/21
The “Bespoke 50” is a basket of noteworthy growth stocks in the Russell 3,000. To make the list, a stock must have strong earnings growth prospects along with an attractive price chart based on Bespoke’s analysis. The Bespoke 50 is updated weekly on Thursday unless otherwise noted. There were no changes to the list this week.
The Bespoke 50 is available with a Bespoke Premium subscription or a Bespoke Institutional subscription. You can learn more about our subscription offerings at our Membership Options page, or simply start a two-week trial at our sign-up page.

The Bespoke 50 performance chart shown does not represent actual investment results. The Bespoke 50 is updated weekly on Thursday. Performance is based on equally weighting each of the 50 stocks (2% each) and is calculated using each stock’s opening price as of Friday morning each week. Entry prices and exit prices used for stocks that are added or removed from the Bespoke 50 are based on Friday’s opening price. Any potential commissions, brokerage fees, or dividends are not included in the Bespoke 50 performance calculation, but the performance shown is net of a hypothetical annual advisory fee of 0.85%. Performance tracking for the Bespoke 50 and the Russell 3,000 total return index begins on March 5th, 2012 when the Bespoke 50 was first published. Past performance is not a guarantee of future results. The Bespoke 50 is meant to be an idea generator for investors and not a recommendation to buy or sell any specific securities. It is not personalized advice because it in no way takes into account an investor’s individual needs. As always, investors should conduct their own research when buying or selling individual securities. Click here to read our full disclosure on hypothetical performance tracking. Bespoke representatives or wealth management clients may have positions in securities discussed or mentioned in its published content.
Outperformance from Low Volatility
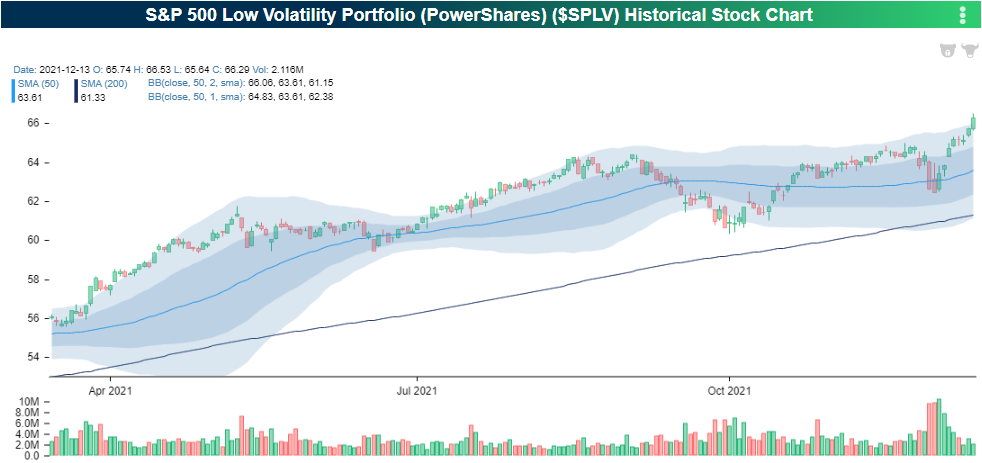
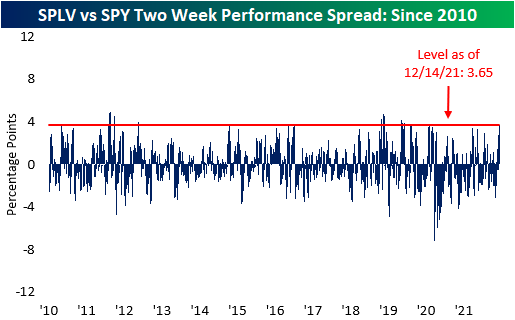
Over the last two weeks, low volatility names have outperformed the broader market. The PowerShares S&P 500 Low Volatility ETF (SPLV) has ticked 6.83% higher over the last 10 trading days as of yesterday’s close. During the same time period, the SPDR S&P 500 ETF (SPY) moved 4.36% higher. Investors have poured into safer names so far in December, but SPLV has still underperformed SPY on a YTD basis. Over the last three months, the performance of these two ETF’s has been essentially identical with SPLV breaking out to all-time highs, while SPY struggles to break out. Although investors are not necessarily selling off equities broadly, they are gaining exposure to lower volatility names, which could be interpreted as taking a more conservative posture.
The two-week performance spread between SPLV and SPY is currently at an elevated level, and as of earlier this week (12/14) was at its widest level since 1/31/20, which is less than a month before the COVID correction began. Investors should watch the performance of low volatility names moving forward, as continued outperformance would signal that investors are becoming increasingly risk averse. Click here to view Bespoke’s premium membership options.
Investor Sentiment Turning More and More Bearish
The S&P 500 is hovering right near record highs but recent sentiment readings would have you thinking otherwise. The AAII‘s reading on bullish sentiment fell from 29.7% last week to 25.2% this week. That is the lowest reading on bullish sentiment since the week of September 16th when it was at 22.4%.

Bearish sentiment, in turn, rose 8.8 percentage points to 39.3%. While that was the largest one-week uptick in bearish sentiment since mid-September, the actual level of bearish sentiment was even higher only two weeks ago.
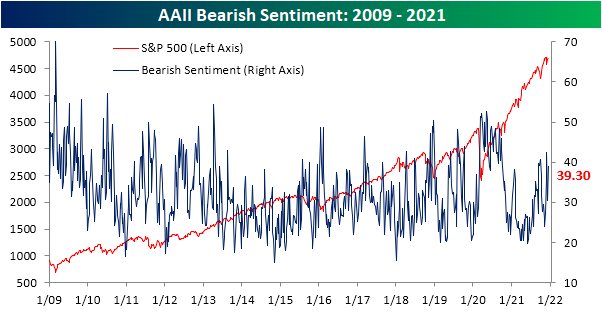
Neutral sentiment fell by a similar amount to bullish sentiment this week. After hitting one of the highest levels of the past couple of years last week, neutral sentiment moderated to 35.4% this week.

While the AAII survey showed overall bearish tones this week, the NAAIM Exposure Index has taken an even more pessimistic turn. This index ranges from +200 (leveraged long) to -200 (leveraged short) and this week the index fell to 52.2. That indicates reporting investment managers’ exposure to US equities is roughly 50%. That is the lowest reading since this past spring and prior to that, the spring of 2020 was the last time with as low of a reading.
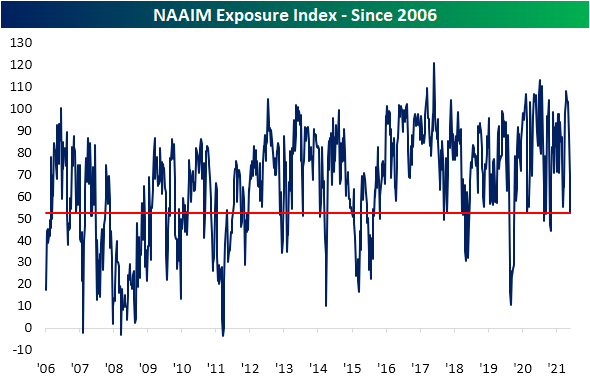
Given the rise of bearish sentiment across indicators this week, our sentiment composite has now fallen to the lowest level since May 2020. This composite averages across the current readings (normalized by standard deviations from the historical average) for the bull-bear spreads of the AAII and Investors Intelligence surveys and the NAAIM index. Click here to view Bespoke’s premium membership options.

Chart of the Day: Don’t Chase A Sugar High After FOMC
Claims Back Above 200K
After hitting a multi-decade low last week, seasonally adjusted initial jobless claims rose back above 200K. While a minor deterioration, the current level of claims remains one of the strongest readings on record.
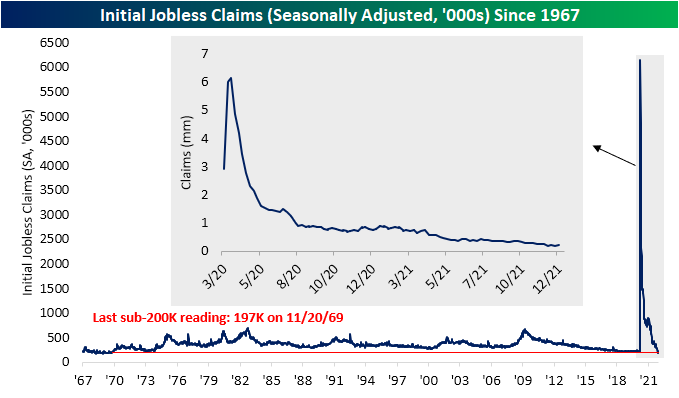
While claims are at a healthy level, the seasonal adjustment has had a flattering effect recently. Unlike the SA number, on a nonseasonally adjusted basis, no recent week has seen a sub-200K reading with the current week falling to 267.5K from 283.9K the prior week. From a seasonal perspective, claims falling week over week is very much normal for the given week of the year (50th) with nearly 90% of years since 1967 experiencing such a decline. Only five other weeks of the year have seen claims fall WoW more consistently.


Delayed one week to initial jobless claims, continuing claims hit a new low for the pandemic of 1.845 million in the first week of December. The marks the strongest reading since the week of March 13, 2020.
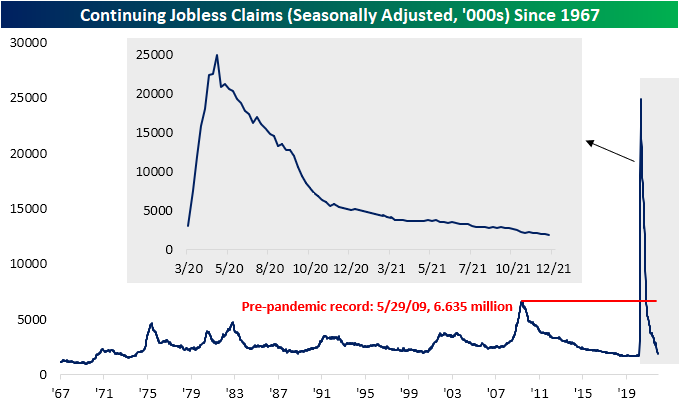
Including all other programs creates an additional week of lag making the most recent data through the final week of November. Total continuing claims as of that week ticked higher to 2.46 million versus 1.95 million the previous week. That is the highest reading since the end of October. Even though pandemic era programs have now technically expired, the pickup in claims was broad across programs but regular state claims were the main driver of the overall increase. Click here to view Bespoke’s premium membership options.

Bespoke’s Morning Lineup – 12/16/21 – Fourth Time the Charm?
See what’s driving market performance around the world in today’s Morning Lineup. Bespoke’s Morning Lineup is the best way to start your trading day. Read it now by starting a two-week trial to Bespoke Premium. CLICK HERE to learn more and start your trial.
“No one goes there nowadays, it’s too crowded.” – Yogi Berra
Sentiment towards the market may be negative these days, but that hasn’t stopped the S&P 500 from quietly hanging around right at record highs. As Yogi Berra would say, “Everyone is selling stocks because they’re going up so much.”
Futures are staging a relatively impressive follow-through this morning in the wake of yesterday’s FOMC meeting where Powell and company didn’t give the market any surprises. To maintain those gains, though, we have a lot of economic data to get through. Already released were Jobless Claims (slightly higher than expected), Housing Starts (better than expected), Building Permits (better than expected), and the Philly Fed (weaker than expected). On deck we still have to wait for Industrial Production, Capacity Utilization, flash PMI readings for the month of December, and then the KC Fed Manufacturing report at 11 AM will close out the slate of data for the week. That’s a lot to digest!
We haven’t talked a lot about earnings recently, but there are a number of notable names reporting today including Accenture (ACN), Adobe (ADBE), Jabil (JBL), and FedEx (FDX). Of those four, ACN is trading up 10%, JBL is up 5%, and ADBE is trading down 7%. FDX isn’t scheduled to report until after the close.
Read today’s Morning Lineup for a recap of all the major market news and events from around the world, including the latest US and international COVID trends.
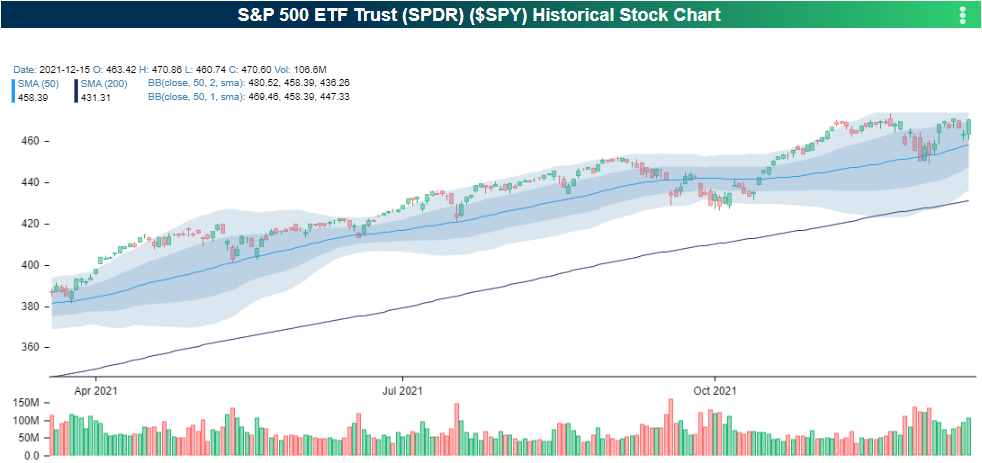
Earlier in the week, we referred to it as the market treading water, and that remained the case heading into yesterday’s close as the S&P 500 closed right at its recent resistance level once again. As shown in the chart of SPY below, the ETF has managed to trade above $470 multiple times in the last six weeks as it first broached that level on an intraday basis on November 5th. Since then, there have been multiple attempts to break through that level, but all of them have failed. Could today be the day? In pre-market trading, SPY is trading just above $473 which would be close to a record intraday high. If these levels hold throughout the trading day and SPY can stay above $470, it could just be the welcome Santa was waiting for.

Start a two-week trial to Bespoke Premium to read today’s full Morning Lineup.