Bespoke’s Morning Lineup – 12/2/21 – Apple (AAPL) Falls
See what’s driving market performance around the world in today’s Morning Lineup. Bespoke’s Morning Lineup is the best way to start your trading day. Read it now by starting a two-week trial to Bespoke Premium. CLICK HERE to learn more and start your trial.
“Our liquidity is fine. As a matter of fact, it’s better than fine. It’s strong.” – Kenneth Lay
Good Morning Subscriber,
Today marks the 20-year anniversary of the Enron bankruptcy, and if you think the last few days in the market have been lousy, it was nothing compared to late 2001 when we were in the middle of the dot-com bust, coming out of 9/11, and heading into another rough year in 2002 when Worldcom eventually collapsed as well.
Futures are higher this morning, but traders aren’t even waiting until the opening bell to raise cash as Nasdaq futures have reversed into the red and the Dow and S&P 500 have also given up much of their earlier gains. One of the main culprits behind the weakness this morning is a report from Bloomberg that Apple (AAPL) has told suppliers that demand for the iPhone 13 after the holidays may not be as strong as previously estimated. AAPL had been a bright spot in the Nasdaq over the last few trading days but is trading down over 3% in the pre-market.
Read today’s Morning Lineup for a recap of all the major market news and events from around the world, including the latest US and international COVID trends.
Yesterday was an extremely disappointing day for small caps as the Russell 2000 rallied more than 2% intraday only to give it all back and a lot more throughout the trading day. By the time the closing bell rang, the Russell 2000 was down over 2% on the day. Since the Russell 2000 tracking ETF (IWM) launched in early 2000, yesterday was just the 9th time that the ETF saw a similar intraday rally (+2%) only to finish the day down more than 2%. Each of those days is shown as a red dot in the chart below. Despite over 20 years of trading history for IWM, all eight prior occurrences were confined to a two-month period in 2008 (six occurrences) and a three-week period in 2020 (two occurrences).
Unlike yesterday’s reversal, most of the other occurrences came well into market declines. The only exception was on 3/3/20. Interestingly enough, that occurrence also followed a period of sideways trading for the Russell where it broke out of a multi-month range (but didn’t reach a new high) only to reverse and sell-off sharply into the COVID crash. It’s unlikely the Omicron variant will cause the same sort of market turmoil that COVID initially created in early 2020, but the Fed is certainly not going to be nearly accommodative going forward as they have been since early 2020.
This morning, Russell 2000 futures are indicated higher by about 1%, but to put that in perspective, the gain isn’t even enough to bring the index back to where it was trading 15 minutes before the close yesterday.

Start a two-week trial to Bespoke Premium to read today’s full Morning Lineup.
Daily Sector Snapshot — 12/1/21
Stocks with Aggressive Valuations Getting Crushed
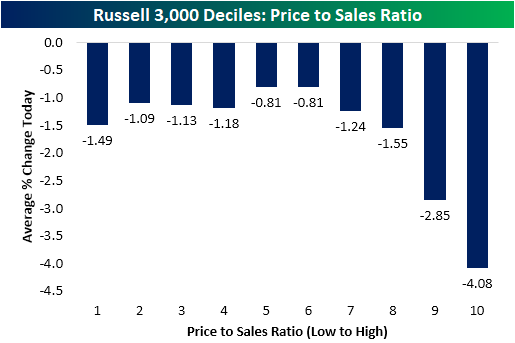
One theme popping in and out of recent price action has been the underperformance of stocks with higher valuations. That was once again apparent today. In the chart below, we break down the Russell 3,000 into equal-sized deciles (10 groups) based on their price to sales ratios (sorted from those with the lowest ratio to the highest). As shown, the stocks with the highest P/S ratios significantly underperformed today with the decile of the most elevated ratios falling over 4% on average. The ninth decile similarly experienced outsized declines of 2.85% compared to the average stock in the index which fell 1.6% today.
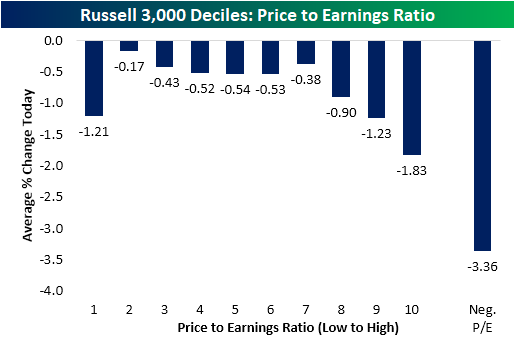
Turning to another common valuation metric, the P/E ratio, the dynamic is just as evident. In the chart below we again broke the Russell 3,000 into equal-sized deciles except we separated out all stocks with negative earnings as well. Nearly a third of the index has a negative P/E ratio at this point! As shown, the stocks with negative earnings (no P/E ratio) got absolutely crushed today with an average drop of 3.36%. Click here to view Bespoke’s premium membership options.
B.I.G. Tips – Earnings Triple Plays
We’ve just published our newest Top Triple Plays report. This season we identified 40 earnings triple plays that we think have attractive price charts right now.
What is a triple play? When a stock reports quarterly earnings, it registers a “triple play” when it beats analyst EPS estimates, beats analyst revenue estimates, and raises forward guidance. We coined the term back in the mid-2000s, and you can read more about it at Investopedia.com. We consider triple plays to be the cream of the crop of earnings season, and we’re constantly finding new long-term buy opportunities from this basket of names each quarter. You can track the newest earnings triple plays on a daily basis at our Triple Plays page if you’re a Bespoke Premium or Bespoke Institutional member. To read our newest report and see the triple plays that we think look the best right now, start a two-week trial to Bespoke Premium!

Semis Outperforming Software
Over the last year, the performance of semiconductor stocks has been highly correlated to that of software stocks. Over the last 12 months, the median 50-day rolling correlation coefficient between the iShares Expanded Tech-Software Sector ETF (IGV) and the iShares Semiconductor ETF (SOXX) was +0.77. Currently, the 50-day rolling correlation coefficient is 0.59 due to a recent divergence between the performance of the two ETFs, and since the start of November, the two ETFs have actually been inversely correlated (-0.31). As you can see in the chart below, SOXX has significantly outperformed IGV since the start of November. gaining 11.7% versus a 6.6% decline for IGV.

As implied by the chart above, the relative strength of SOXX vs IGV has moved upwards since the start of November. Although SOXX has mostly outperformed IGV over the last 12 months, the difference between the two is currently the largest of the last 12 months with a 24 percentage point spread between the performance of the two ETFs.

Looking back over time, when we have seen similar performance disparities where SOXX outperforms IGV by 15 percentage points or more in a month (with no prior occurrences in the prior three months), forward performance has been mixed. In terms of the next week’s performance, in two of the three prior periods, SOXX underperformed over the following week, but over the following month and three months, SOXX continued to outperform. A sample size of three is on the small side, and even with just three occurrences there is no clear trend in performance, so we wouldn’t read too much into the results. Click here to view Bespoke’s premium membership options.

Chart of the Day – Average December Performance By Sector
B.I.G. Tips – December 2021 Seasonality
Bespoke Market Calendar — December 2021
Please click the image below to view our December 2021 market calendar. This calendar includes the S&P 500’s average percentage change and average intraday chart pattern for each trading day during the upcoming month. It also includes market holidays and options expiration dates plus the dates of key economic indicator releases. Start a two-week free trial to one of Bespoke’s three research levels.

November 2021 Headlines
Bespoke’s Morning Lineup – 12/1/21 – Loves Me, Loves Me Not
See what’s driving market performance around the world in today’s Morning Lineup. Bespoke’s Morning Lineup is the best way to start your trading day. Read it now by starting a two-week trial to Bespoke Premium. CLICK HERE to learn more and start your trial.
“I am a warrior, so that my son may be a merchant, so that his son may be a poet.” – John Quincy Adams
You may think that the market has been volatile over the last several trading days, but just be thankful it’s not 1824. Back in November of that year, no candidate for President received the required majority of electoral votes in the election which forced Congress, on December 1st, to turn the election over the House of Representatives and basically choose between Andrew Jackson and John Quincy Adams. The actual winner wasn’t decided for more than two months when John Quincy Adams came out on top in early February 1825. Despite coming in second in the actual election, Adams’ victory came thanks to the backing of Henry Clay in what was called the ‘Corrupt Bargain’, and because he wasn’t the most popular candidate in the election, Adams’ presidency was largely considered to be unimpactful. Can you imagine in this political climate if the House was actually deciding an election today?
Futures are higher this morning as investors can’t decide which way they want the market to go as the S&P 500 goes back and forth between 1% losses and 1% gains in a game of ‘Loves Me, Loves Me Not’. One thing to note is that just as Monday’s 1% rally was weaker in magnitude than Friday’s drop, we’re seeing the same pattern play out today where the S&P 500 is on pace to open higher by 1.4% after Tuesday’s 1.95% decline.
In yesterday’s rout, only seven stocks in the S&P 500 finished the day higher, which was the weakest breadth reading since June 11th, 2020. Breadth in small caps wasn’t nearly as weak as the S&P 500 yesterday (more than 400 stocks traded higher), but its breadth reading on Friday was also the weakest since June 11th.
On the data docket today, the ADP Private Payroll report for November was released at 8:15 AM and came in higher than expected with little impact on futures. The only two other reports on the calendar today are Construction Spending and ISM Manufacturing which will be released at 10 AM. Powell and Yellen will also be testifying in front of the House this morning, and yesterday, the S&P 500 was only down modestly while the Nasdaq was actually higher before Powell’s testimony.
Read today’s Morning Lineup for a recap of all the major market news and events from around the world, including the latest US and international COVID trends.
2021 has really been a pretty crazy year for small-cap stocks. After doubling from its COVID lows, the Russell 2000 peaked in early March and traded in a sideways range through the summer and into the fall. After several close calls at a 10% correction, including a 9.7% drop on a closing basis through mid-July, the Russell finally broke out of its trading range in early November to trade at a new record high. From its first new high on 11/2, though, the breakout for IWM didn’t last long. After rallying an additional 3.4% in the four trading days since its first new closing high since March, it’s been a one-way trip lower for small caps ever since, and through yesterday’s close, IWM closed down 10.1% from its record high earlier this month. What the Russell couldn’t do in more than six months from early March through the end of Summer, it did in just 15 trading days this month!

Start a two-week trial to Bespoke Premium to read today’s full Morning Lineup.