Daily Sector Snapshot — 12/23/21
Bespoke Annual Report Teaser
In our 2022 Outlook, we cover numerous topics to both sum up the year and give insights into 2022. This report is available at all three subscription levels. If you are not yet a member, sign up below to get access to the entirety of the repot by clicking any of the links below:
Bespoke Newsletter — $395 annually or $49 monthly (includes 14-day trial)
Bespoke Premium — $995 annually or $99 monthly (includes 14-day trial)
Bespoke Institutional — $1995 annually or $195/month (includes 14-day trial)
If you’re already a member, click here for the whole report.
Below is a complimentary look at a handful of pages from our 2022 Outlook. You can view the table of contents below as well. Join our community today and give it a read!


Bears Still Outnumber Bulls Despite Rally
The S&P 500 is currently at record highs, but recent sentiment readings are still relatively bearish. However, this isn’t necessarily negative for markets, as it gives the opportunity for bears to shift their position, which would likely be accompanied by an increase in equity purchases. AAII‘s reading on bullish sentiment moved from 25.2% last week to 29.6% this week. This week’s reading is still 6.7 percentage points below the average since 2009.

In turn, bearish sentiment dropped from 39.3% down to 33.9%, which is only 1.8 percentage points higher than the historical average level. This week’s reading was also the second-largest week-over-week decline in bearish sentiment since September 9th.

Neutral sentiment ticked higher by 1.2 percentage points, resulting in 36.6% of respondents reporting a neutral view of the market. This is the lowest absolute change in a month and is 5.0 percentage points higher than the average level.

The NAAIM Exposure Index moved higher this week alongside bullish sentiment. The index ranges from +200 (levered long) to -200 (levered short) and this week the index moved from 52.2 to 67.0, essentially erasing last week’s significant drop. That indicates reporting investment managers’ exposure to US equities is roughly 67%. Click here to view Bespoke’s premium membership options.

Claims Inline With Last Week
Three weeks ago, seasonally adjusted initial jobless claims hit a multi-decade low, breaking below 200K. Last week, claims moved slightly higher to 205K, and the reading was identical this week. Although we are not at our lows, the reading of 205K is historically strong.
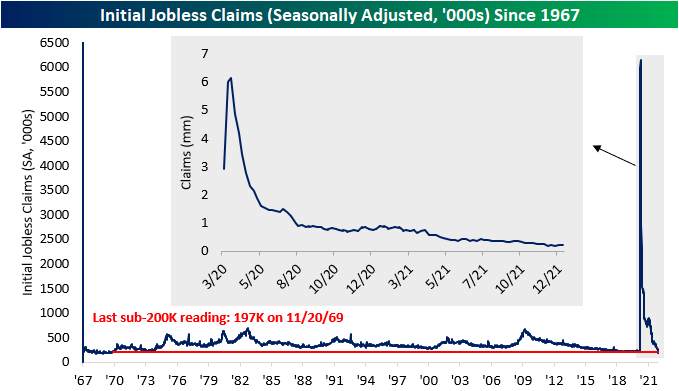
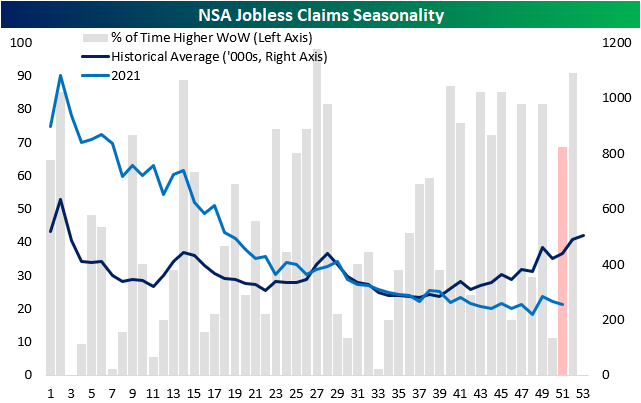
While claims are at a healthy level, the seasonal adjustment has had a flattering effect recently. Historically, the number of non-seasonally adjusted claims has moved higher this week 68.5% of the time but moved lower this week. This comes as NSA claims have broken historical trends over the last 15 weeks, moving lower when the average of all years moves higher. Non-seasonally adjusted claims decreased from 266K to 254K.

Continuing claims, which are delayed by a week, came in slightly lower than the previous week at 1.86M, setting a new pandemic low. This is the lowest level since March 13, 2020.

Including all other programs creates an additional week of lag making the most recent data through the first week of December. In that week, total continuing claims ticked lower, moving from 2.46M to 2.12M. The decrease in claims was consistent across all programs. Click here to view Bespoke’s premium membership options.


Chart of the Day: Will Santa Bring Breadth For Christmas?
S&P 500 Performance Around Christmas
With Christmas just two days away and markets closed tomorrow, many investors are on the watch for a ‘Santa Claus’ rally. In all periods in the post-WWII era, the average S&P 500 performance in the week leading up to Christmas is a gain of 0.5% with positive returns just over two-thirds of the time. The average performance in the week after Christmas is slightly higher at 0.7%, but the consistency of positive returns is the same. This year, the S&P 500 has performed considerably better than its pre-Christmas average gaining 2.25% through midday Thursday. Since 1945, the S&P 500 has traded up more than 1% in the week leading up to Christmas 23 times (30.3%), and in those prior 23 years, the average week after Christmas performance was actually a bit weaker than normal with an average gain of 0.3% and positive returns just over 60% of the time. That compares to an average gain of 0.7% in the same week for all years since 1945.
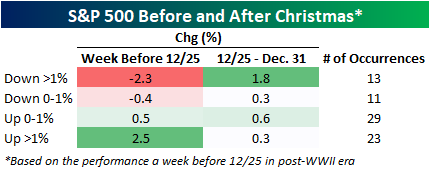
The table below lists each year since 1945 that the S&P 500 was up over 1% in the week leading up to Christmas along with how it performed in the final week of the year. Of those 23 prior years, there were actually 14 where the S&P 500 rallied 2% or more in the week leading up to Christmas with the last occurrence seven years ago back in 2014. While those types of gains may have put investors in a good mood for the Christmas holiday, it didn’t leave much powder left for the last week of the year as the median gain was just 0.05% with positive returns half of the time. Click here to view Bespoke’s premium membership options.

Bespoke’s Morning Lineup – 12/23/21 – Busy Data Day
See what’s driving market performance around the world in today’s Morning Lineup. Bespoke’s Morning Lineup is the best way to start your trading day. Read it now by starting a two-week trial to Bespoke Premium. CLICK HERE to learn more and start your trial.
“Economics is extremely useful as a form of employment for economists.” – John Kenneth Galbraith
Economists will be working hard this morning as a large batch of economic data was just released. Initial Jobless Claims were right in line with forecasts while Continuing Claims were modestly higher than expected. Personal Income and Spending were both right in line with forecasts at 0.4% and 0.6, respectively. PCE inflation data was slightly higher than expected while Durable Goods Orders rose 2.5% which was ahead of expectations. Even after all that data, though, equity futures are little changed from where they were before the data was released. Still on the docket, we have Michigan Confidence and New Home Sales at 10 AM and natural gas inventories at 10:30.
Read today’s Morning Lineup for a recap of all the major market news and events from around the world, including the latest US and international COVID trends.
Since its intraday low on Monday, the small-cap Russell 2000 has rallied more than 5.5% and yet still only modestly above the level it opened at last Thursday. Talk about a volatile stretch! A lot of bullish investors want to call the bottom of the small-cap correction. While the downtrend from the November high appears to have been broken, the Russell still has something to prove with both the 50 and 200-day moving averages, which are both now sloping downwards, looming above. In a bearish tape, these levels typically act as resistance. If the tape is really turning bullish for small caps, these moving averages will need to be taken out.

Start a two-week trial to Bespoke Premium to read today’s full Morning Lineup.
Daily Sector Snapshot — 12/22/21
Best and Worst Performers Since Thanksgiving
Although the Russell 1000 is now pretty much right back in line with its pre-Thanksgiving level, certain stocks have seen dramatic moves during that same span. Of the 25 stocks that have experienced the largest gains since 11/25, 19 were down on the year leading up to Thanksgiving, and the average stock had declined by 20.0%. Since then, those 25 stocks have gained an average of 13.1%, with Smartsheet (SMAR) and Chegg (CHGG) leading the group with gains of 22.2% and 20.4%, respectively.

Of the Russell 1000 members that have performed the worst since Thanksgiving, their average YTD performance leading up to Thanksgiving was a gain of 85.7% while the median performance was much less but still an impressive +25.6%. Of these 25 stocks, 18 were positive YTD through Thanksgiving, and the average decline since then is 23.6%. Everbridge (EVBG) and DocuSign (DOCU) topped this list with declines of 37.2% and 36.6% since Thanksgiving, respectively.

Based on the data above, it appears as if there was some rotation in the Russell 1000 as investors shifted from leaders to laggards. Essentially, the worse a stock performed between the start of the year and Thanksgiving, the better it has performed since, at least for the top 25 movers to the upside. For the 25 stocks that have declined the most since Thanksgiving, there seems to be very little correlation between the size of the move to the upside before Thanksgiving and performance since then. In the charts below, GameStop (GME) Upstart (UPST) were omitted from the chart but included in the R squared calculation due to visual distortion. Click here to view Bespoke’s premium membership options.

The Bespoke Report – 2022 Annual Outlook
Our Bespoke Report – 2022 Outlook is now available for Bespoke subscribers. This report covers everything you need to know about the set-up for financial markets and the economy heading into 2022. If there’s ever a “must-read” Bespoke report, this is it!
You can read our 2022 Outlook by signing up for any of our three membership levels. You can review our membership levels here or simply start a two-week trial to one of them using the links below.
Bespoke Newsletter $49/month – Includes 14-day trial
Bespoke Premium $99/month – Includes 14-day trial
Bespoke Institutional $195/month – Includes 14-day trial
