Treasuries Yields Blow Past Dividend Yields
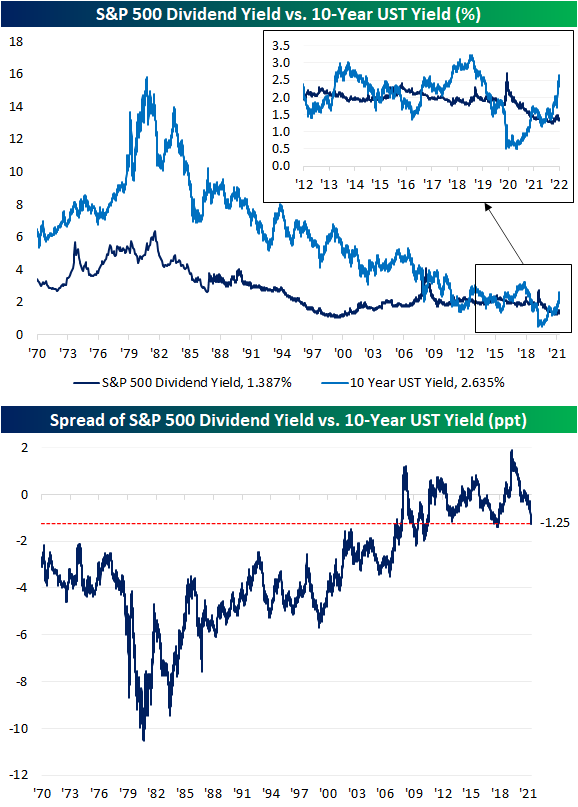
US Treasury yields have experienced a dramatic move higher as the market prices in continued rate hikes in the near future. With the increase in long-term Treasury yields, we’re starting to see what looks like the end of a period where the S&P 500 and the 10-year Treasury fought back and forth over which asset class had a more attractive yield.
As shown in the chart below, from 1970 right up to the period before the global financial crisis, the 10-year yield consistently yielded more than the S&P 500. As the Fed cut rates to zero during the crisis, though, the S&P 500 went on to see multiple periods where its dividend yield was in excess of the 10-year Treasury yield. With the recent surge in yields as the Fed embarks on what the market expects to be an aggressive rate hiking cycle, the script has been completely flipped. The 10-year now offers a roughly 125 bps higher yield than the S&P 500 dividend yield which is the widest spread since the fall of 2018 and before that, the fall of 2011. As the spread between the S&P 500 dividend yield and 10-year Treasury yield hits the low end of the GFC/post-GFC era, we would note that current levels are still roughly 200 bps higher than the historical average going back to 1970. Click here to view Bespoke’s premium membership options.
Near Record Low in Jobless Claims
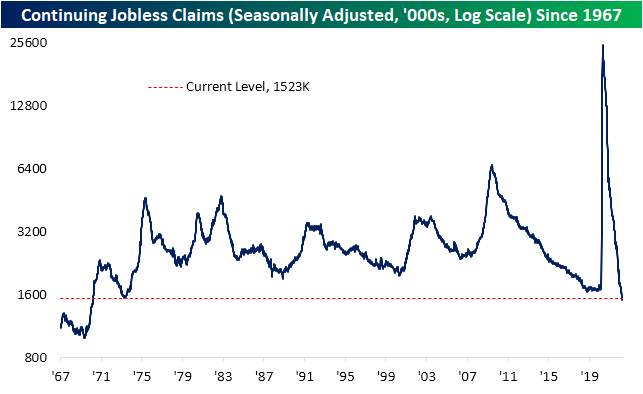
This week’s jobless claims release was significant in a couple of ways. For starters, the Department of Labor revised seasonal adjustment factors (more on that below) and second, the most recent print for the seasonally adjusted number hit one of the lowest levels on record. Claims came in at 166K which tied the number from two weeks ago (after revisions) for the second-lowest reading on record behind the week of 11/29/68. That week’s reading was only 4K lower.

As for continuing claims, this week’s reading was higher rising from 1.506 million to 1.523 million. Having come off last week’s low, that remains one of the strongest levels since 1970.
Pivoting back to initial claims, while adjusted claims are at multi-decade lows, non-seasonally adjusted claims are very healthy but not quite at a record. At current levels of 193.1K, the only year with a lower reading for the comparable week of the year was 1969 (170K) but at the seasonal lows in the few years prior to the pandemic, claims were even stronger than they are now. So while unadjusted claims are strong, the seasonally adjusted number was even more eyecatching this week.
As for why the seasonally adjusted number appears so much stronger, as shown in the second chart below, the current week of the year has historically been the second most consistent week of the year in seeing a week-over-week increase in claims. As a period with consistent seasonal headwinds, the seasonal adjustment would control for this by depressing the level of claims by a relatively strong seasonal factor. That usual increase was not seen this year as NSA claims were actually slightly lower falling from 196.8K to 193.1K. That means seasonal adjustment helped out what was already a strong number.
Additionally worth noting this week is the DOL changed its seasonal adjustment methodology. The DOL fully describes the change in this week’s release and links to further reading on the topic for those interested in going deeper into the weeds, but to briefly summarize: periods when the level of an economic indicator experiences historic shifts in levels as claims did in 2020 and 2021, multiplicative adjustment (which has been used in “normal times” like prior to the pandemic and from here forward) would tend to over or understate adjusted claims. Additive adjustment, on the other hand, is less affected by the actual level of the indicator meaning it would lead to more accurate approximations of seasonally adjusted numbers in times of sudden spikes in the series. This methodology has been used throughout the pandemic period. Now that claims have more or less returned to a more normal range of readings, the DOL sees it justifiable to switch the seasonal adjustment methodology back to multiplicative. While that does not mean too much for interpreting claims, that change in methodology has led to some large downward revisions. Click here to view Bespoke’s premium membership options.

Chart of the Day: Breadth Is Still Weak
Bespoke’s Morning Lineup – 4/7/22 – Defensives Rise to the Top
See what’s driving market performance around the world in today’s Morning Lineup. Bespoke’s Morning Lineup is the best way to start your trading day. Read it now by starting a two-week trial to Bespoke Premium. CLICK HERE to learn more and start your trial.
“If you can learn to create a state of mind that is not affected by the market’s behaviour, the struggle will cease to exist.” – Mark Douglas
After two lousy days for the equity market, futures were attempting a bounce but have drifted back towards the unchanged level as treasury yields rise and oil prices bounce. Initial Jobless Claims were just released and they came in at 166K which was below the 200K consensus forecast and the lowest weekly reading since November 1968! Continuing Claims, however, surprised to the upside coming in at a level of 1.523 million versus forecasts for a level of 1.302 million. That’s it for economic data today, but in terms of fed-speak, at 9 AM eastern we’ll hear from Bullard, and then at 2 PM Bostic and Evans will be speaking.
Read today’s Morning Lineup for a recap of all the major market news and events from around the world, including the latest US and international COVID trends.
It’s been a rough week for the broader market as the S&P 500 has declined more than 2.5% over the last five trading days (since 3/30 close). In looking at the performance of individual sectors over that span, performance has been about what you would expect in a tape with a more defensive tone. While cyclical sectors like Industrials, Consumer Discretionary, Technology, and Financials have been crushed with declines of more than 4%. Defensive sectors have actually bucked the trend. Utilities have actually risen more than 3%, Real Estate is up over 2%, Consumer Staples has risen 1.8%, and even Health Care is in the green.
What’s also notable about the current levels of sectors is that in spite of the weak tape, just three sectors closed below their 50-day moving averages yesterday, and six sectors are either at overbought or ‘extreme’ overbought levels. That fact says more about how much the market had rallied leading up to the last day of the quarter than it does about the magnitude of the recent declines. After gains like we saw in the back half of March, it is only natural to see the market take a pause or even pull back.

Start a two-week trial to Bespoke Premium to read today’s full Morning Lineup.
Stock Market Volatility: It’s Higher Than You Think
“You pay a very high price for a cheery consensus. It won’t be the economy that will do in investors; it will be the investors themselves. Uncertainty is actually the friend of the buyer of long-term values.” Warren Buffett
You don’t need us to tell you that 2022 has been a volatile year for the stock market, but in one way it has been even more volatile than you think. Nowhere in the equity market has the uncertainty and day-to-day moves been higher than in the Nasdaq. Over the last 50 trading days, the Nasdaq’s average daily move has been a gain or loss of 1.76%, and on a YTD basis, the average remains at a still unsettling level of 1.66%. To put this in perspective, in all of 2021, there were only 37 days that even experienced a gain or loss of 1.66% or more. While volatility has spiked this year, relative to other periods in the last thirty years or so, there have been plenty of other stretches when the average daily move spiked even more. Back in early 2020, the Nasdaq’s average daily move over the prior 50 trading days spiked to more than 3%, and in October 2011, the average daily move spiked to just over 2%. Those two periods, however, pale in comparison to the Financial Crisis when the average daily move approached 4% per day! That was even greater than the highs from the bursting of the dot-com bubble when 3% daily moves for the Nasdaq were routine.

Although the Nasdaq’s average daily move is nowhere near its highest levels of the last twenty years, volatility has still been extremely high. While this week is only three trading days old, we’ve already had three days where the Nasdaq had a daily move of at least 1%, and as a result, we have now had a total of 12 straight weeks where the Nasdaq experienced at least three 1% daily moves (even including holiday-shortened weeks). In the chart below, we show weekly streaks where the Nasdaq experienced at least three trading days of 1% moves. The current streak isn’t over, but it has already eclipsed any streaks seen during the COVID crash or the Financial Crisis. In fact, to find a longer streak you have to go all the way back to September 2002 in the waning days of the dot-com crash.
As noted above, Warren Buffett once said that uncertainty is the friend of the buyer of long-term values, but volatility can be unsettling for individual investors, and as Peter Lynch once said, “Not everyone has the stomach. If you are susceptible to selling everything in a panic, you ought to avoid stocks and mutual funds altogether.” Click here to view Bespoke’s premium membership options.

The Closer – March Minutes Reaction, Balance Sheet Runoff, Neighbor Data, EIA – 4/6/22
Log-in here if you’re a member with access to the Closer.
Looking for deeper insight into markets? In tonight’s Closer sent to Bespoke Institutional clients, we begin with a summary of the minutes from the March FOMC meeting. We follow up with a note on balance sheet runoff and the market’s reaction to today’s release of the minutes. We then recap some data South and North of the border in the form of Mexican vehicle production and the record Ivey PMI in Canada. We close out with a recap of this week’s petroleum stockpile data from the EIA.
If you’re wondering what the Closer is like each day, click here or on the thumbnail image below for a sample of a few pages from the report.

See today’s full post-market Closer and everything else Bespoke publishes by starting a 14-day trial to Bespoke Institutional today!
Daily Sector Snapshot — 4/6/22
B.I.G. Tips – Back-to-Back 2%+ Drops for the Nasdaq 100
2022: A Story of Rotation
The S&P 500 is lower again today and dropping back below its 200-DMA as of this writing. After rallying over 11% in the second half of March, the S&P 500’s current leg lower has brought it down roughly 3.4% from the March 29th closing high. As for which stocks have done the best and worst during the recent leg lower, it has more or less been a story of rotation from earlier this year. To get a gauge on this, in the charts below, we took a look at the performance of S&P 500 stocks since the recent peak in late March based on their performance during the two legs lower (1/3 through 1/27 and 2/9 through 3/8) as well as during the two rebounds off those lows (1/27 through 2/9 and 3/8 through 3/29).
We go through the charts in a little more detail below, but the short of it is that since the recent high in the final days of March, the worst performing stocks have been the same names that were the weakest during the prior two legs lower this year. Conversely, the stocks that have outperformed recently have been the same ones that were the worst performers during the two rallies in late January/early February and during March. Click here to view Bespoke’s premium membership options.
The two charts below show the performance of S&P 500 stocks since 3/29 grouped into deciles based on how they performed during selloffs from 1/3 to 1/27 (top chart) and from 2/9 to 3/8 (bottom chart). In the case of both charts, the general trend has been that stocks that performed the worst during each of the prior sell-off this year have also been the worst performers over the last week or so since the close on 3/29, while the stocks holding up the best are the same ones that outperformed during those declines.

Similar to the analysis above, the two charts below show the performance of S&P 500 stocks since 3/29 grouped into deciles based on how they performed in the rallies from 1/27 to 2/9 (top chart) and from 3/8 to 3/29 (bottom chart). In this case, the general trend has been that stocks that performed the best during each of the rallies this year have been the worst performers since the close on 3/29, while the stocks that underperformed the most in the two rallies have sold off the least during this most recent decline.
