Bond Market Massively Oversold
The sell-off in bond prices over the last six months has been extreme to say the least. There are a number of ways we could highlight the carnage for bond investors, but one way is to look at how far bond indices are trading below their 200-day moving averages. As shown below, the Bloomberg US Aggregate Bond Market Total Return index is currently 8.5% below its 200-day moving average.

Going back to 1988 when daily price data begins, the 200-DMA spread is currently 2x more negative than any prior extreme oversold reading. Click here to learn more about Bespoke’s premium financial markets research.

Chart of the Day: New Low in 52-Week Lows
Bespoke’s Morning Lineup – 5/3/22 – Tepid Follow Through
See what’s driving market performance around the world in today’s Morning Lineup. Bespoke’s Morning Lineup is the best way to start your trading day. Read it now by starting a two-week trial to Bespoke Premium. CLICK HERE to learn more and start your trial.
“In times of great stress or adversity, it’s always best to keep busy, to plow your anger and your energy into something positive.” – Lee Iacocca

Below is a snippet of content from today’s Morning Lineup for Bespoke Premium members. Start a two-week trial to Bespoke Premium now to access the full report.
Futures have been trading on either side of the flatline this morning and most of the overnight session as investors look to digest Monday’s volatility. US Treasury yields are modestly lower along with crude oil prices, while bitcoin is either modestly higher or lower depending on when you look. In economic data, Germany had some better than expected data related to employment, and this morning in the US we’ll get updates on Factory Orders, JOLTS, and Durable Goods.
In today’s Morning Lineup, we recap overnight events in Asia and Europe (pg 4), economic data in China and Europe (pg 5), and a lot more.
That was quite a reversal in the S&P 500 yesterday! After trading down over 1% heading into the final hour of trading, the market got an early start on a ‘turnaround Tuesday’ and rallied nearly 2% into the close. By the time the closing bell rang, the S&P 500 was up over half of a percent.

Reversals like Monday’s always feel great in the moment, but do they really mean anything in terms of the market’s future direction? Since the early 1990s, yesterday was just the 17th time that the S&P 500 was down at 3 PM but rallied by more than 1.5% in the final hour of trading to finish the day in positive territory. The two most recent occurrences were this past January (1/24) and before that December 2018 (12/27/18). After that, you have to go back to October 2011 to find the most recent occurrence. The chart below shows the S&P 500 on a long-term basis going back to 1995, and we have included red dots to show the day of every prior reversal like yesterday when the S&P 500 was down at 3 PM, rallied more than 1.5% in the last hour, and then closed in positive territory.
Looking at the various occurrences, there appears to be little in the way of a clear trend. While there were multiple occurrences during the dot-com bust and the financial crisis, there were also a number of occurrences just after the March 2009 low and in the years since.

Start a two-week trial to Bespoke Premium to read today’s full Morning Lineup.
Daily Sector Snapshot — 5/2/22
Bespoke Market Calendar — May 2022
Please click the image below to view our May 2022 market calendar. This calendar includes the S&P 500’s average percentage change and average intraday chart pattern for each trading day during the upcoming month. It also includes market holidays and options expiration dates plus the dates of key economic indicator releases. Click here to view Bespoke’s premium membership options.

Near Record Consistency for the US Dollar in April
The US dollar performed incredibly strong in the month of April, gaining a total of 4.7%. In addition, there were only three trading days in which the US Dollar Index traded lower, which constitutes a monthly positivity rate of 86%. Notably, this is the third-highest positivity rate on record (since 1971), falling short of just July 1975 and May of 2012. In this week’s Bespoke Report, we conducted a deep dive into the dollar’s recent strength. You can access this report by becoming a paid subscriber today. Click here to view Bespoke’s premium membership options.

The month where the Dollar Index experienced the highest consistency of positive returns was in May 2012 when it finished higher on just under 87% of the month’s trading days. During that month, the Dollar Index recovered after falling 175 basis points between the end of 2011 and the start of May. In May alone, it rallied 542 basis points, more than erasing the YTD losses heading into the month. Economic weakness in Europe and concerns over Greece being able to make its debt payments also caused a rotation into dollar-denominated assets.
In July of 1975, the Dollar Index traded higher on 86.4% of the month’s trading days. Back then, the US was emerging from a recession as the economy was beginning to show signs of strength. Inflation was running hot, which caused short-term interest rates to rise and attracted foreign investors, thus boosting demand for the dollar.
Last month, demand for the Dollar moved consistently higher as higher yields attracted foreign investors. In addition, weakness in the Yen attracted foreign capital as well. With just three down days during the month, the Dollar Index was up on 85.7% of the month’s trading days.
In November of 1978, the daily positivity rates for the US Dollar Index hit 80%. The dollar had experienced weakness leading up to November, shedding 13.9% of its value on a YTD basis. Rates continued to tick higher amidst a high inflationary environment.
As mentioned in our Conference Call Recaps, strength in the US dollar acts as a headwind to Corporate America, as constant selling prices in foreign countries leads to less favorable currency conversions. So, how have equity markets performed during and after strong months for the dollar? In May 2012, the S&P 500 lost 6.3% but gained 4.0% in the following month. Three and six months out, the index was up 7.3% and 8.1%, respectively. In July 1975, the S&P 500 traded down by 6.8% and proceeded to lose another 2.1% in the following month. Three months out, the S&P 500 was up just 33 basis points. However, six months out, the index had gained 13.6%. Lastly, in November 1978, the S&P 500 gained just 1.7% after trading down by 9.2% in the previous month. In the following month, the index gained 1.5%. Three and six months later, the index was up 1.7% and 4.6%, respectively. For the sake of comparison, in April of this year, the S&P 500 shed 8.8% of its value, so weakness in equities during months where the Dollar Index has been very consistent to the upside is not necessariliy out of the ordinary.
Chart of the Day: Less Consumer ‘Calls’ to Dealer ‘Raises’
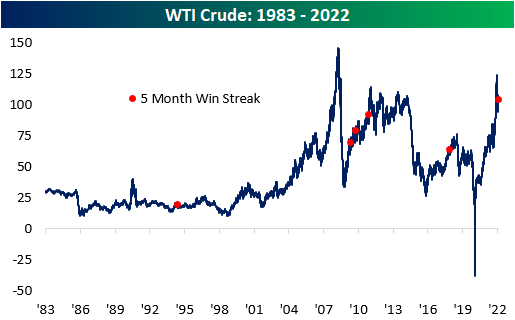
WTI Monthly Win Streak
It’s been a monster year for cruse oil and it continued in April. For the month, WTI rallied 4.4% and finished the month at $104.7 per barrel. This comes as Russian supply has been essentially cut off from Western markets, the Saudis hold back supply, and US drillers are in the process of ramping up capacity to meet demand, which is a process that takes several months to complete. Most notable about April’s rally was that it marked the fifth consecutive month in which WTI rallied, which is tied for the second-longest streak on record (since 1983). The only streak that was longer was in late 2010/early 2011 when WTI notched eight straight months of gains.

The chart below outlines the long-term price chart of WTI Crude. Two aspects stand out in the chart. First, crude oil tended to see additional gains in the short term following these five-month streaks. Secondly, it is also worth noting that three of these occurrences happened within two years (2009 – 2011), which was likely due to aggregate demand ticking higher as the economy emerged from the Global Financial Crisis. The current period is relatively similar, as the global reopening has put upward pressure on the demand curve after oil producers lowered output during COVID. That increased demand has also been exacerbated by supply constraints following the Russian invasion of Ukraine.
The table below outlines the performance of WTI after the fifth straight month of prior five-month win streaks. WTI tended to trade down over the following month but reversed course to book gains in the following three and six months. In the month following these streaks, WTI averaged a loss of 4.4% (median: -4.8%), booking gains just one time (20%). After three months, WTI averaged a gain of 5.1% (median: 5.5%), performing positively 80% of the time. Over the next six months, average performance and positivity rates declined to 1.9% and 60%, respectively.
Higher oil prices affect energy prices, shipping rates, and the cost of so many more secondary products. Therefore, higher oil prices tend to be inflationary and crimp corporate margins as well as consumer buying power. Historically speaking, though, the S&P 500 has averaged a gain of 8.3% (median: 12.1%) during these streaks, which is 420 basis points higher than the average performance for all five-month periods since 1983. In the month following these streaks, the S&P 500 has averaged a gain of 1.4% (median: 3.2%), which is higher than the historical average as well. In the next three months, the index has averaged a gain of 4.5% (median: 4.9%) with positivity rates higher than that of all periods. Similar to what we see in the six-month performance of WTI, positivity rates moderate for the S&P 500, with average six-month gains of 3.2% (median: 0.2%) versus around 5% for all six-month periods since 1983. Click here to view Bespoke’s premium membership options.

Bespoke’s Morning Lineup – 5/2/22 – New Month, Same Market
See what’s driving market performance around the world in today’s Morning Lineup. Bespoke’s Morning Lineup is the best way to start your trading day. Read it now by starting a two-week trial to Bespoke Premium. CLICK HERE to learn more and start your trial.
“Take a simple idea, and take it seriously.” – Charlie Munger
Below is a snippet of content from today’s Morning Lineup for Bespoke Premium members. Start a two-week trial to Bespoke Premium now to access the full report.
Futures were modestly positive for most of the overnight session but have weakened as we get closer to the opening bell. After a day like last Friday, it’s all but guaranteed that we’re likely to see continued volatility today. As they say around the roulette wheel, “Round and round it goes. Where it stops nobody knows.”
Economic data at 10 AM will also be a big factor in where the market trades today, but the looming Fed meeting mid-week will be on everyone’s mind. While the current rate hiking cycle has already been called the most aggressive in a generation, it’s important to remember that the Fed has only hiked 25 bps so far. That will change this week as a hike of at least 50 bps is pretty much fully priced in. The most ironic aspect of it all, though, is that after months of delay, the Fed is starting to ramp up the pace of hikes just after a negative Q1 US GDP print, slower than expected economic data, and even weaker data in China and Europe.
In today’s Morning Lineup, we recap overnight events in Asia and Europe (pg 4), economic data in China and Europe (pg 5), as well as a recap of PMI data for April (pg 6).
It’s often said that the stock market is one of the only places where investors don’t like bargains. In other words, when the market is rallying investors love stocks, but when it declines, investors can’t get out fast enough. Warren Buffett is one investor who has bucked the conventional approach of many investors and consistently used weakness as an opportunity. His actions in Q1 were a perfect example. In this weekend’s annual meeting, one slide that stood out was the breakdown of Berkshire Hathaway’s equity purchases during the quarter. Of the nearly $52 billion in purchases made by Berkshire in Q1, just under 80% of it occurred during the highlighted period in the chart (from 2/21 through 3/15) when prices in the quarter were at their weakest.
It’s also worth keeping in mind what Berkshire was buying during the quarter. It wasn’t growth stocks that were down the most. Instead, it was mostly in stocks with reasonable valuations like Chevron (CVX). Occidental (OXY), Alleghany (Y), HP (HPQ), and even Apple (AAPL).

Start a two-week trial to Bespoke Premium to read today’s full Morning Lineup.
Berkshire’s Annual Conference
Warren Buffett’s Berkshire Hathaway (BRK/B) is hosting its annual investor conference this weekend, and investors who don’t make the pilgrimage to Omaha will tune in from around the world to hear Buffett and Munger provide their insights into the economy and the market. You can tune in here. We often hear that Berkshire’s stock gets a lift coming out of the annual meeting, but a look at the stock’s performance leading up to and after the annual meeting suggests otherwise.
Over the last 20 years, BRK/B stock has averaged a gain of 1.0% (median: 80 bps) in the week leading up to the meeting with gains 71% of the time. That average is higher than the average of all periods by a factor of just over four, with positivity rates 18 percentage points higher than that of all periods.
Immediately coming out of the conference, Berkshire has also tended to get a lift with the stock averaging a gain of 40 bps (median: 80 bps) the day after the conference, but that bounce didn’t tend to last long. As shown in the table, on both an average and median basis, returns over the following week were lower than the following day. Buffett would be the last person to advocate a strategy of short-term trading of Berkshire stock, so it’s only fitting that there isn’t a clear pattern of performance leading up to or immediately after his annual “Woodstock for Capitalists”. Click here to view Bespoke’s premium membership options.
