The US Is The Lone Overbought Country
While the S&P 500 (SPY) may have had a string of weakness over the past week and a half resulting in a test of its 50-DMA, SPY has held up much better than many other major economies. Looking across the ETFs tracking the equity markets of each of the 23 major economies in or Global Macro Dashboard, the US, Switzerland (EWL), and Sweden (EWD) are the only countries that are up month to date with each country posting an over 1% gain. Conversely, China (MCHI) has been the worst performer having fallen 6.42% MTD. Additionally, alongside MCHI, Malaysia (EWM) and Japan (EWJ) are the only countries in the red year to date.
While EWD and EWL are up a similar amount to the US MTD, the US has been the only country of the 23 to have hit a 52-week high in July. Most of the rest of the world saw 52-week highs in the first days of June or earlier. In addition to the US being one of the only countries up on the month and recently putting in a 52-week high, the past couple of days’ rally off of the 50-DMA has resulted in the US returning back to overbought territory. By comparison, Switzerland (EWL) and Taiwan (EWT) are the only other ETFs that are even above their 50-DMA whereas 13 countries are oversold.
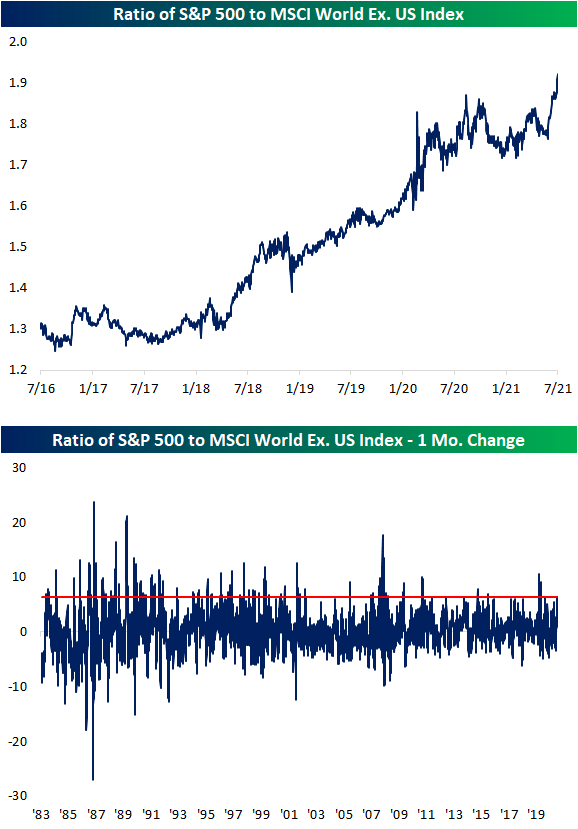
To show the outperformance of the US relative to other geographies, in the chart below, we show the ratio of the S&P 500 to the MSCI World Index that excludes the US. Since June, the ratio has taken off surpassing the highs from last summer in the process. In fact, the ratio has risen over 6% over the past month which stands in the top 5% of all monthly moves. That is the biggest one-month uptick in the ratio since it rose 9 percentage points last April. Prior to that, July 2016 was the last time in which the US has seen as large of a degree of outperformance. Click here to view Bespoke’s premium membership options.
Bespoke’s Morning Lineup – 7/21/21 – Sector Performance All Over the Place
See what’s driving market performance around the world in today’s Morning Lineup. Bespoke’s Morning Lineup is the best way to start your trading day. Read it now by starting a two-week free trial to Bespoke Premium. CLICK HERE to learn more and start your free trial.
“The market does not beat them. They beat themselves, because though they have brains they cannot sit tight.” – Jesse Livermore
Futures were higher across the board earlier but have given up some of their gains heading into the open as the Nasdaq is now indicated to open modestly lower. Small caps are continuing to build on yesterday’s gains with the Russell 2000 indicated to open up more than 0.7% as investors reassess whether concerns over the Delta variant were a bit overdone.
Read today’s Morning Lineup for a recap of all the major market news and events from around the world, the latest US and international COVID trends including our vaccination trackers, and much more.
It’s not often that the spread in 5-day performance between the best and worst-performing sectors in the market is over 10 percentage points, but that is where things stand heading into today’s trading. While Energy is down over 9% in the last five trading days, three sectors (Utilities, Real Estate, and Consumer Staples) are all up over 1% in the last week. Despite its recent sell-off, Energy is still one of the top-performing sectors in the S&P 500 this year with a gain of over 28%. While the losses in Energy have been painful, one could still argue that the sector remains in a consolidation mode following its monster gains off the late 2020 lows. Technology, meanwhile, remains right in the middle of the pack in terms of YTD performance, but in the short-term is one of the most overbought sector’s trailing only Health Care.

Daily Sector Snapshot — 7/20/21
Chart of the Day – Buy the Dippers Out in Full Force
Bespoke Stock Scores — 7/20/21
Bitcoin Drawdown
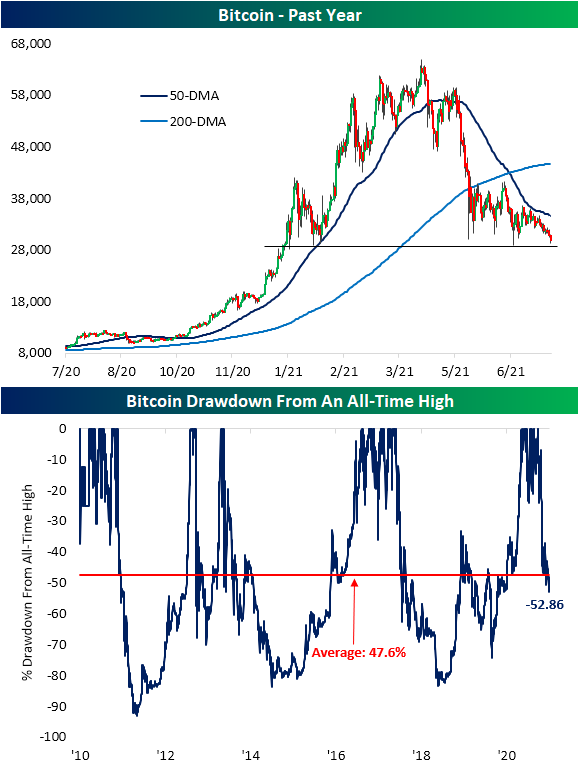
In today’s Morning Lineup, we detailed how the total market cap of crypto is reaching new lows in the context of a multi-month unwind. That is as the largest cryptocurrency, Bitcoin, falls below 30,000 for the first time since January 1st. Granted, back then Bitcoin had never been that high before. Today, Bitcoin is down for the fourth day in a row nearing extreme oversold territory (measured by 2 or more standard deviations below its 50-DMA) and is testing support around the lows from earlier in the spring. That all leaves Bitcoin 52.86% below its all-time high above 63,000 from April 15th. While the price of the crypto being cut in half may sound dramatic, as we have noted in the past, it is more or less par for the course for the speculative asset. As shown in the second chart below, through its history the average decline from an all-time high has been 47.6% (median 51.9%); only a few percentage points less than the current drawdown. Click here to view Bespoke’s premium membership options.
Strong Starts, Some Building Weakness In Permits
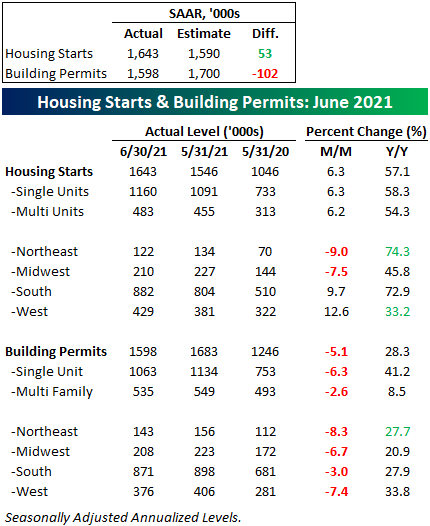
This morning’s release of Housing Starts and Building Permits for the month of June was mixed relative to both last month’s levels and expectations, but the overall trends remain positive. Starting out with the details, Housing Starts rose 6.3% versus March and topped expectations by 53K (1.643 million vs 1.590 million). Building Permits, meanwhile, missed expectations by nearly twice the amount that Starts beat expectations (1.598 million vs 1.7 million), and they also fell just over 5% relative to May.
In terms of single versus multi-family units, Housing Starts saw a uniform increase rising just over 6%, but on a regional basis, strength was seen in the West and South, while both the Northeast and Midwest experienced high single-digit declines. Building Permits were weaker at the single-family level than the multi-family level, which could be a result of higher input costs. On a regional basis, though, Permits were down all over the country with the South seeing the most modest declines.
One note regarding the miss in Permits – although they were lower than Starts in June, they were higher than Starts in each of the past 15 months, so they have been running at a stronger pace than Starts for quite some time. Click here to view Bespoke’s premium membership options and receive a more detailed analysis of economic data.
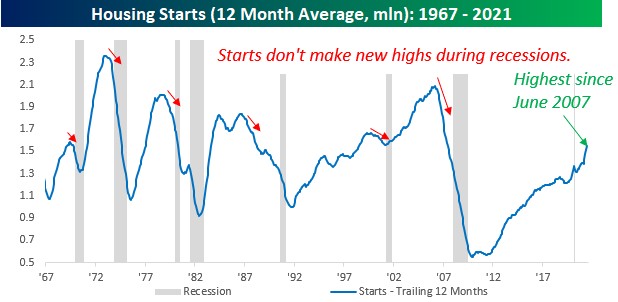
As far as overall trends in Housing Starts and Permits are concerned, the longer-term trend remains positive. Housing Starts are a great leading indicator of the business cycle, and the 12-month average continued to surge to new multi-year highs in June reaching the highest level since June 2007.
Zooming in on just the last ten or so years, both Housing Starts and Building Permits experienced a brief dip in the aftermath of the COVID outbreak but quickly resumed their upward trend and have been accelerating to the upside. Also, barring a complete cratering of the monthly numbers, these 12-month averages should continue to rise in the months ahead.
Single-family Housing Starts and Building Permits are rising at an even faster rate. Also notable is that despite the fact that there was a notable divergence between Building Permits and Housing Starts this month, the 12-month average of single-family Starts and Permits were practically the same (1.130 million vs 1.138 million).
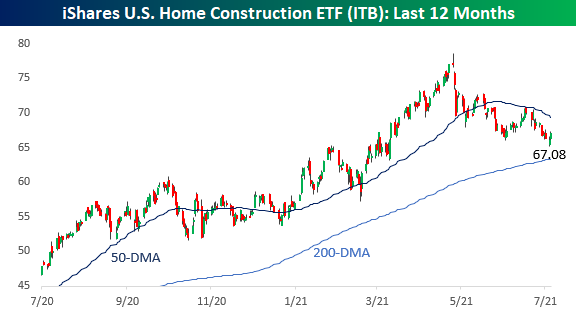
The fundamental backdrop for Housing Starts and Building Permits may still look positive, but homebuilder stocks have been under pressure lately after an insanely strong rally earlier in the year. Since its peak in early May, the iShares Home Construction ETF (ITB) has dropped 15% in a series of lower highs and lower lows.
Higher labor and input costs have weighed on sentiment for the sector, but some of the input costs have reversed and lower interest rates should also act as a tailwind. Looking at a longer-term chart, there has been a positive correlation between Housing Starts relative to the performance of ITB, and as these charts illustrate, while the short-term picture for ITB (above) looks somewhat ominous, the longer-term picture looks much more benign. As shown below, the recent pullback in ITB looks more like a reversion to the mean as they got a bit ahead of themselves earlier this year. One trend to keep in mind going forward for the homebuilders is that if the recent price declines for housing inputs remain in place, they have the potential to see some significant improvements to margins if they can continue to command higher prices.
The Health Care Tortoise and the Hare
When COVID first started to worry equity markets in early 2000, one of the names investors immediately flocked to was telehealth provider Teladoc (TDOC). TDOC was the perfect COVID play as it enabled people to continue seeing doctors through digital means at a time when the world was locked down. TDOC actually performed very well in the normal months leading up to COVID, and shares continued to shoot higher even as the broad market declined in late February and March 2020. By early August 2020, TDOC was up over 100% since 2/19/20 — the date of the high point for the S&P just prior to the COVID Crash. After a consolidation period in the fall and early winter 2020, TDOC went on another run from December through February of this year and was up nearly 150% YoY on February 19th of this year.
While TDOC was a beloved stock during the first stages of the COVID pandemic, it has been a serious drag over the last five months. Since peaking in mid-February, shares are down roughly 50% from their highs. Notably, as TDOC has been falling this year, traditional health care providers like hospital company HCA and healthcare provider and insurer UnitedHealth (UNH) have been rallying to new highs. As shown below, the six-month chart patterns for HCA and UNH couldn’t look more different than the chart of TDOC. Click here to view Bespoke’s premium membership options.
What we find most surprising is that Teladoc (TDOC) is now underperforming both HCA and UNH since 2/19/20 when SPY hit its pre-pandemic high just before COVID began worrying markets. As shown below, at one point earlier this year, TDOC was outperforming its traditional health care competitors by more than 100 percentage points. That outperformance has been fully erased over the last five months. Since 2/19/20, TDOC is now up just 29% versus gains of 45% for HCA and 34% for UNH.
Last year there was a lot of talk about telehealth becoming one of the biggest long-term trends that we’d see accelerate because of COVID. That trend could certainly continue over the coming years and decades, but TDOC’s recent performance just goes to show you that sometimes the best-laid plans don’t necessarily play out the way investors may expect them to, and past performance is certainly not indicative of future performance over any time frame.
Of course, we should note that going back further over the last five years, TDOC is still significantly outperforming both HCA and UNH. In fact, TDOC is a 10-bagger over the last five years with a gain of 1,183%, while HCA and UNH have also performed well but are only up 169% and 206%, respectively.
Bespoke’s Morning Lineup – 7/20/21 – Do Over
See what’s driving market performance around the world in today’s Morning Lineup. Bespoke’s Morning Lineup is the best way to start your trading day. Read it now by starting a two-week free trial to Bespoke Premium. CLICK HERE to learn more and start your free trial.
“The definition of insanity is doing the same thing over and over again, but expecting different results.“ – Albert Einstein
While it wasn’t the only factor behind yesterday’s decline, a key event that spooked many investors (and computers) was a comment from UK Chief Scientific Adviser Sir Patrick Wallace who said that 60% of UK COVID hospitalizations were fully vaccinated. Later in the day, shortly before the US close, he clarified his remarks to say that his numbers were reversed and that less than 40% of all hospitalizations were fully vaccinated. That was a pretty big error, but one that caused some relief on the part of investors as stocks finished off their lows of the afternoon.
Today, futures are higher again, but still well below where they closed Friday. Rising COVID cases have been one driver of the weakness but not the only headwind facing the market. In the short term, investors will also have to contend with weak seasonal trends as well as high expectations heading into earnings season.
Read today’s Morning Lineup for a recap of all the major market news and events from around the world, the latest US and international COVID trends including our vaccination trackers, and much more.
One thing that’s been happening over and over again in the market is that every time the S&P 500 tests its 50-day moving average (DMA), it has managed to bounce. Over the last year, there have only been two times where the S&P 500 closed below its 50-DMA and continued to decline meaningfully from there. Both of those occurrences were last year. Before yesterday, there were six other times this year where the 50-DMA came into play and each time the S&P 500 bounced significantly from there. Obviously, this can’t keep going on forever, but in the short-term, but until it doesn’t work anymore, the ‘buy the dippers’ will likely stick with what has worked.


