Mixed Housing Data
On the same day that mortgage applications plunged 12% and one day after homebuilder sentiment for the month of May showed a large decline, the latest updates on Housing Starts and Building Permits showed a mixed picture. While economists were expecting both reports to decline, the drop in Housing Starts was more than expected while the decline in Building Permits was slightly less than forecast.
The table below breaks down this month’s report by type of unit and region and shows both the m/m and y/y changes. For Housing Starts, the 0.2% m/m decline was driven entirely by single-family units (-7.3%) while multi-family units surged 15.3%. With respect to Building Permits, we saw a similar breakdown although the disparity wasn’t nearly as large as single-family units dropped 4.6% while multi-family units declined just 1%. On a regional basis, the Northeast and Midwest experienced 20%+ declines on a m/m basis while every region except the South experienced declines in Building Permits.
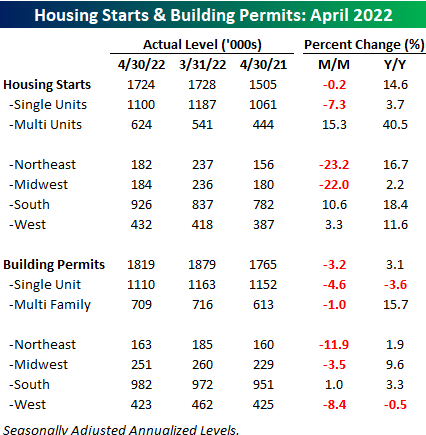
While both Housing Starts and Building Permits declined on a m/m basis, the longer-term trend for both still remains intact. At 1.759 million, the 12-month average of Building Permits came in at the highest level since January 2007 while the 1.659 million average level of Building Permits was the highest since February 2007. Higher interest rates have caused a slowdown in housing at the margin, but longer-term trends have yet to show signs of rolling over. Click here to learn more about Bespoke’s premium stock market research service.

Bespoke’s Morning Lineup – 5/18/22 – Retail Wreck
See what’s driving market performance around the world in today’s Morning Lineup. Bespoke’s Morning Lineup is the best way to start your trading day. Read it now by starting a two-week trial to Bespoke Premium. CLICK HERE to learn more and start your trial.
“Inflation is a form of tax, a tax that we all collectively must pay.” – Henry Hazlitt

Below is a snippet of content from today’s Morning Lineup for Bespoke Premium members. Start a two-week trial to Bespoke Premium now to access the full report.
This week the tax of inflation is being felt most by retailers as two of the nation’s largest retailers have gotten absolutely destroyed in the last two days. Futures are indicated lower this morning, but one could make the case, given the plunge in Target (TGT) shares this morning, that it could even be worse. Oil prices are also trading up close to 2%, the ten-year yield is back up to 3%, and the dollar is trading lower.
On the economic front, we’re about to get the latest updates on Housing Starts and Building Permits for April, but if mortgage data is any indication, the data isn’t likely to be very strong.
In today’s Morning Lineup, we recap the continued developments in retail earnings (pg 4), market action in Asia and Europe (pg 4), economic data in Asia and Europe (pg 5), and a lot more.
If you thought yesterday’s 11% pounding of Walmart (WMT) was bad, meet Target (TGT). After reporting significantly weaker than expected earnings on better than expected revenues, shares are trading down more than 20% in the pre-market. The company blamed ‘unexpectedly high costs’ that it faced throughout the quarter for the earnings miss, and didn’t provide much additional detail in its release. Investors aren’t waiting for further clarity, though. With margins falling more than 400 basis points (bps), the stock is trading down more than 20% in the pre-market and is easily on pace for not only its worst earnings reaction day in at least 20 years, but also its worst one-day drop since the 1987 crash.
Yesterday, WMT had its largest one-day decline since the 1987 crash and now TGT is on pace to do the same! The experiences of both companies further reinforce the point that we are operating in one of the most complicated macro environments that any company or investor has had to deal with. Few companies are so entwined into so many aspects of the US economy as WMT and TGT, and their logistics and supply chain operations rival or exceed those of most other companies. If they’re having these types of issues keeping up with the rapidly changing environment, who isn’t?


Start a two-week trial to Bespoke Premium to read today’s full Morning Lineup.
Chart of the Day – Dollar’s 15% Ride Higher
Daily Sector Snapshot — 5/17/22
Bespoke Stock Scores — 5/17/22
The Overbought Buck
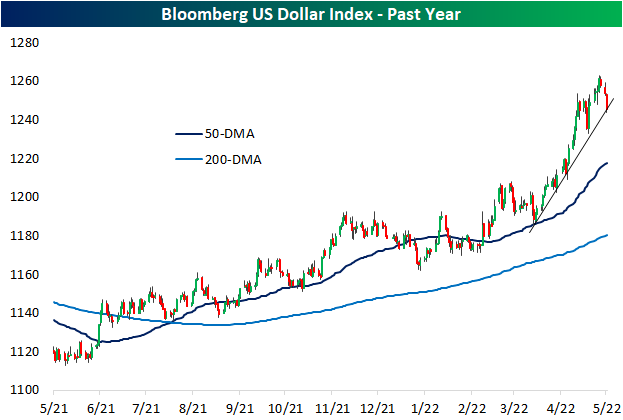
The US dollar has surged amidst the weakness in risk assets in 2022. While also part of a longer-term and more gradual uptrend over the past year, in the past couple of months the Bloomberg Dollar Index has seen its uptrend steepen significantly. Since the last retest of its 50-DMA at the end of March, the dollar was up over 6% through the closing high last Thursday. To round out last week and start this week, the dollar has pulled back sharply with a 1.25% decline. While that may not sound like much, it ranks in the third percentile of all 3-day moves going back to the start of the index in 2005.
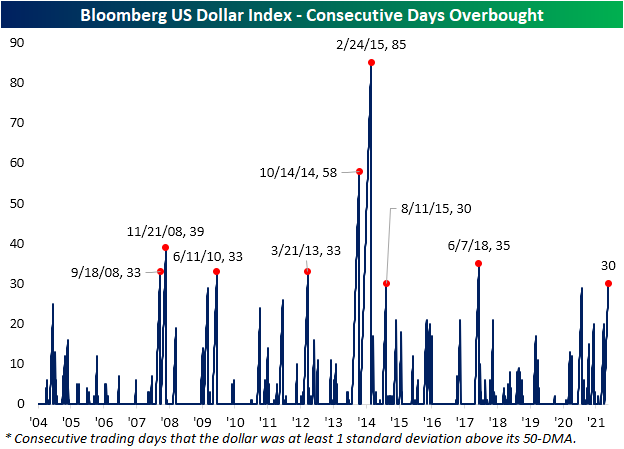
At the moment, the dollar is testing the aforementioned steep uptrend off the late March low. Assuming that the uptrend or any recent lows do not provide support, the dollar has much further to go until it would test its 50-DMA. In fact, the dollar would currently need to fall another 2.28% to reach its 50-DMA as it has consistently traded well above that moving average for multiple weeks in a row. As shown in the second chart below, the dollar recently hit some of the most overbought levels of the past five years, and the long stretch of days with overbought (1+ standard deviation above its 50-DMA) readings has continued.

While recent declines have put the streak on the ropes, today marks the 30th consecutive trading day that the dollar has been at least one standard deviation above its 50-DMA. Going back through the history of the index, there have only been 8 other streaks that have also gone on for at least 30 trading days. The most extended of these ended in February 2015 at 85 days long. The next longest only occurred shortly before that in October 2014.
Additionally, given the dollar has been pulling back, it could be reasoned that stocks with heavy domestic exposure would underperform relative to those with more international exposure. Since last Thursday, that has largely been the case. In the chart below, we have broken down the Russell 1,000 into deciles based on their share of revenues generated from abroad. The first decile is composed entirely of stocks with 100% of revenues generated within the US while the tenth decile is the stocks with the most international exposure. That tenth decile has seen notable outperformance with an average gain of nearly 6% versus an average of 4.2% for all other deciles. The eighth and ninth deciles have also averaged stronger returns than most other groups while the worst performance comes from the first decile, the 100% domestic stocks. Click here to learn more about Bespoke’s premium stock market research service.

Homebuilders Sentiment Free Fall
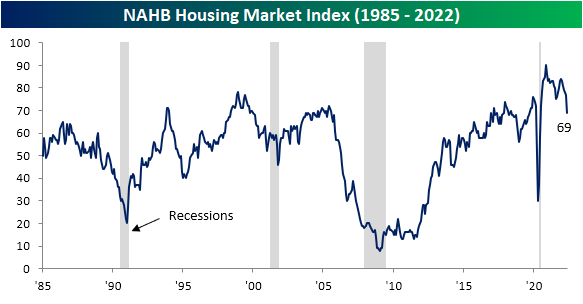
Although material cost pressures have shown some signs of alleviating (for example lumber and copper futures have been grinding lower), the cost to finance a home has only increased with the national average of a 30-year fixed-rate mortgage hovering around 5.5%. That higher cost dampens demand, and homebuilder sentiment has taken a sharp turn lower. The NAHB’s Housing Market Index fell from a top 5% reading of 77 last month all the way down to a new 52-week low of 69 this month. The index has been rolling over for some time now after peaking all the way back in November 2020, and the 8 point month over month decline in May is the worst of that span, ranking as the fourth largest monthly decline in the history of the index. Two of those larger declines came in the midst of recessions/major economic shocks—October 2001 (9/11) and April 2020 (start of the pandemic). The other largest drop was in February 2014.
The big drop in the headline index points to a notable deterioration in reported conditions and similar drops were shared across the sub-indices. Present sales remain the most elevated with its reading of 78 managing to stay in the top decile of its historical range, but just barely so as the 8-point m/m decline also ranks as one of the largest on record. Even though reported sales are holding up decently (albeit far from improving), sentiment for future sales has collapsed. After a double-digit decline this month, the index is below its historical median meaning homebuilders are anticipating activity to slowdown in the coming months. One likely reason is that overall traffic has pulled back sharply. The 9-point month-over-month drop is tied for the second-largest decline on record.

From a geographic standpoint, this month was interesting. As with the national indices, the Midwest and West saw some of the sharpest activity pullbacks in the history of the survey. Those indices are now around similar levels to the spring of 2020. For the South, the decline did not result in an outright collapse below the post-pandemic range, but nonetheless, the decline was enormous by historic standards.
Then there’s the Northeast. While the rest of the country experienced sharp pullbacks, the Northeast index actually rose by 2 points to 76. Although the level remains middling versus its post-pandemic range, it is a notable divergence compared to the rest of the country.

In spite of the report on homebuilder sentiment, homebuilder stocks, as proxied by the iShares US Home Construction ETF (ITB), are actually higher alongside the rest of the market, currently up 1.3%. Those gains on top of the past few days’ rally appear more technical in nature than any sort of improvement in the overall backdrop for the space. As shown below, the group has been hit hard this year as mortgage rates have soared. Hardly at any point this year has the group managed to trade above its moving averages. Click here to learn more about Bespoke’s premium stock market research service.

B.I.G. Tips – Solid Retail Sales
Bespoke’s Morning Lineup – 5/17/22 – 230 Years And Still Going Strong
See what’s driving market performance around the world in today’s Morning Lineup. Bespoke’s Morning Lineup is the best way to start your trading day. Read it now by starting a two-week trial to Bespoke Premium. CLICK HERE to learn more and start your trial.
“What’s good for the United States is good for the New York Stock Exchange. But what’s good for the New York Stock Exchange might not be good for the United States.” – William McChesney Martin
Below is a snippet of content from today’s Morning Lineup for Bespoke Premium members. Start a two-week trial to Bespoke Premium now to access the full report.
If this market has you down lately, you have a group of 24 stockbrokers to thank, who signed the Buttonwood Agreement, which basically established the New York Stock Exchange, 230 years ago today. Through all of the country’s ups and downs, the NYSE has weathered it all, and as bad as 2022 has been for markets, the NYSE has seen worse.
This morning, futures are in a positive mood following on the back of strength in Asia and Europe. Rates are higher, the dollar is down, and crude oil is down for the fifth straight day. In order to remain positive, though, we have a busy day of economic data to get through with Retail Sales at 8:30, Industrial Production and Capacity Utilization at 9:15, and then Business Inventories and Homebuilder Sentiment at 10 AM. As if that wasn’t enough, there will be a number of Fed speakers hitting the wires throughout the trading day.
In today’s Morning Lineup, we recap the continued developments in retail earnings (pg 4), market action in Asia and Europe (pg 4), economic data in Asia and Europe (pg 5), and a lot more.
We’re now in the retail leg of earnings season, and this morning’s report from Walmart (WMT) marks the unofficial end of the reporting period as the stock reported weaker than expected EPS despite stronger than expected revenues (you can thank inflation for that). The stock is currently trading down about 7% which is somewhat fitting given how bad this earnings season has been for the stock market.
The graphic below is from our Earnings Explorer and shows every time in the last 20 years that WMT has gapped down 3% or more in reaction to earnings. Just to illustrate how large this morning’s downside move is for WMT, there have only been two other times in the last 20 years that the stock gapped down 5% or more in reaction to earnings. Those reports were both in February (2018 and 2021), and the stock continued lower from the open to close each time. For a company like WMT with such strong operations and logistics, downside surprises of this magnitude have been few and far between.

Below we show a price chart of WMT for the last year. While the stock broke out of a range in early April, the momentum didn’t last long, and by late April the rally reversed. Last week, the stock broke below prior resistance levels, and while it tried to bounce yesterday, the rally ran out of steam right at the 50-day moving average. At current pre-market levels, WMT will not only be trading back below its 200-DMA, but it will also be trading at oversold levels and its lowest point since early March.

Start a two-week trial to Bespoke Premium to read today’s full Morning Lineup.