Daily Sector Snapshot — 7/27/22
Most Countries Remain Below Pre-COVID Highs
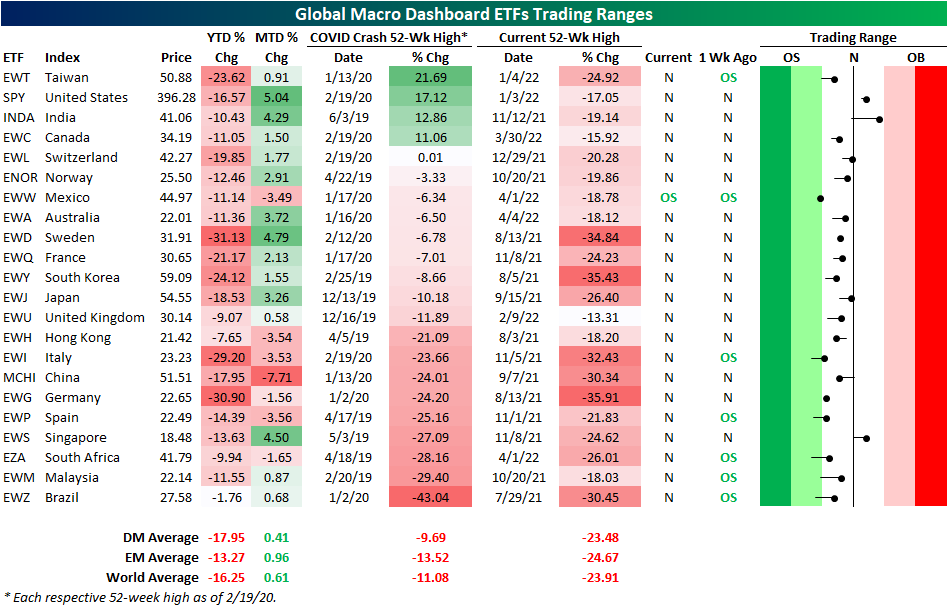
As we do the last Wednesday of each month, today we published our latest update of the Global Macro Dashboard which provides an overview of the major economic data and financial markets of 22 major global economies. Taking a look at the US ETFs tracking these same countries shows a broad move higher in equities around the globe during the month of July. The US has led the way higher as the S&P 500 ETF (SPY) has rallied just over 5%. India (INDA), Sweden (EWD), and Singapore (EWS) have seen the next strongest moves with each one rallying 4% or more. That has brought US equities, India, and Singapore back above their 50-DMAs as well.
Given those moves are in the context of much larger pullbacks year to date, most country ETFs also currently remain below their pre-COVID highs (the 52-week high as of the S&P 500 peak on 2/19/20). In fact, SPY, INDA, Taiwan (EWT), and Canada (EWC) are the only countries meaningfully above prior highs. Switzerland (EWL) is also technically a part of that list, but the one basis point difference is not much of a margin. At the moment, Brazil is down the most significantly from its pre-COVID high as it is still down 43%. However, unlike many other countries, the year-to-date decline has been very modest at only 1.76%.
Taking a look at the charts of the four countries that are handily above their pre-COVID highs, the trends of the past year are not exactly positive. Each one currently sits in a multi-month downtrend, and only India and the US have managed to break above their 50-DMAs. Even if those moving averages have been taken out, further progress by bulls would be required to eliminate those downtrends. Click here to learn more about Bespoke’s premium stock market research service.

Chart of the Day – Fed Day Follow Through
Bespoke’s Global Macro Dashboard — 7/27/22
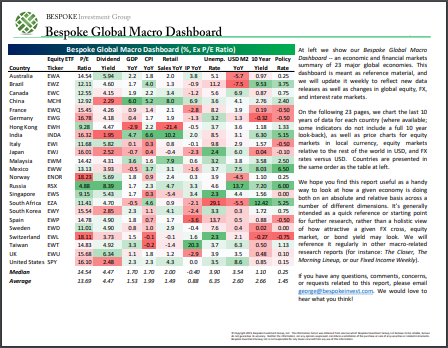
Bespoke’s Global Macro Dashboard is a high-level summary of 22 major economies from around the world. For each country, we provide charts of local equity market prices, relative performance versus global equities, price to earnings ratios, dividend yields, economic growth, unemployment, retail sales and industrial production growth, inflation, money supply, spot FX performance versus the dollar, policy rate, and ten year local government bond yield interest rates. The report is intended as a tool for both reference and idea generation. It’s clients’ first stop for basic background info on how a given economy is performing, and what issues are driving the narrative for that economy. The dashboard helps you get up to speed on and keep track of the basics for the most important economies around the world, informing starting points for further research and risk management. It’s published the last Wednesday of every month at the Bespoke Institutional membership level.
You can access our Global Macro Dashboard by starting a 14-day free trial to Bespoke Institutional now!
Bespoke’s Morning Lineup – 7/27/22 – If Only Every Day Was a Rate Hike Day
See what’s driving market performance around the world in today’s Morning Lineup. Bespoke’s Morning Lineup is the best way to start your trading day. Read it now by starting a two-week trial to Bespoke Premium. CLICK HERE to learn more and start your trial.
“Learning to fly is not pretty but flying is.” – Satya Nadella

Below is a snippet of content from today’s Morning Lineup for Bespoke Premium members. Start a two-week trial to Bespoke Premium now to access the full report.
We’re nearly halfway through what has been billed as the most critical week of earnings season, and based on where futures currently reside, equities are down just marginally on the week. Don’t rest yet, though. Between today’s FOMC meeting, tomorrow’s GDP report, and some critical earnings reports on Friday, we still have a number of potential bumps on the horizon. Economic data released so far today has been better than expectations, and the only report left on the calendar is Pending Home Sales at 10 AM.
Today’s Morning Lineup discusses earnings news out of Europe and the Americas, a preview of the FOMC announcement today, economic data from around the world, and much more.
One of the primary reasons stocks have put up miserable performance numbers this year stems from the tighter monetary policy of the Federal Reserve. For that reason, we found it ironic that on all three days the FOMC has hiked rates this year, stocks rallied. On 3/16, the Fed kicked off the current rate hike cycle with a 25 bps increase in the Fed Funds rate, and in response, the S&P 500 rallied 2.2%. Seven weeks later, the size of the rate hike doubled, but stocks still rallied with the S&P 500 surging just under 3% in what turned out to be the second-best day of the year. Six weeks later on 6/15, in response to the mirage of surging inflation expectations in the Michigan sentiment report, the Fed dropped a 75 bps hike on the market and yet stocks still managed to rally with the S&P 500 rising 1.5%.
In other words, the S&P 500 is down 17.7% this year, but if you had only invested in the market on days when the FOMC hiked rates, you would be looking at a YTD gain of 6.8% in just three days. Conversely, if you had avoided the market on those three days and been long the rest of the year, you’d be down 23% YTD. Nobody ever said the market had to make sense.

Start a two-week trial to Bespoke Premium to read today’s full Morning Lineup.
Daily Sector Snapshot — 7/26/22
B.I.G. Tips – Another Bad Day For the Economy
Bespoke Stock Scores — 7/26/22
Alphabet and Microsoft Down Headed Into Earnings
Both Microsoft (MSFT) and Alphabet (GOOG) are trading down over 2% heading into their earnings report amidst broader market weakness and wariness towards the tech sector. On a year-to-date basis, MSFT and GOOG are both down over 25% and are trading near their 52-week lows. The charts below show MSFT and GOOG over the last twelve months. On the bright side, the rate of change in the two stocks does appear to have support near current levels. However, they are both still in sustained downtrends. Click here to learn more about Bespoke’s premium stock market research service.

Since GOOG went public in 2004, there have only been four days in which the stock traded lower by two percent or more heading into the earnings report. The latest occurrence was on the day of the Q1 2022 report, which was the only time when it also reacted negatively following the earnings report. On average, the stock has gained 2.5% (median: 2.6%) following the report after trading lower by 2%+ leading into earnings. Historically speaking, GOOG has posted gains on its earnings reaction day 58% of the time, gaining an average of 1.7%. While the average and median returns below are positive, we would note that with just four occurrences the sample size is small.

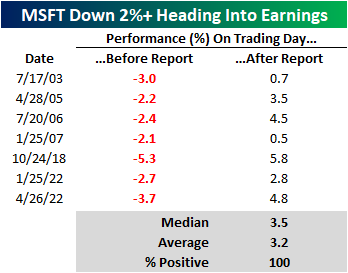
Since October of 2001 (which is as far back as our earnings database goes), MSFT has traded lower by at least two percent in the session heading into an earnings report seven times. Again, the sample size is relatively small, but following every one of these prior occurrences, MSFT gained in the session following its earnings report, booking an average gain of 3.2% (median: 3.5%). For all earnings reports since October of 2001, MSFT has reacted positively to earnings 60% of the time. Click here to learn more about Bespoke’s premium stock market research service.