Firearm Background Checks Decline
Although not a widely-utilized indicator, we like to look at the number of firearm background checks conducted by the NICS every month to gauge geopolitical uncertainty and volatility within the US. In uncertain times, firearm background checks tend to increase, as individuals increasingly acquire the means to protect themselves in a worst-case scenario. On the contrary, when times are ‘good’, background checks tend to decline. An additional factor that impacts background checks is the outlook on firearms legislation. When the populous fears that they may not be able to purchase certain firearms in the future, they will step up purchases in the short term to ‘stock up’. At the end of June, the Supreme Court ruled against the state of New York in regards to carry laws, which could help to expand demand for firearms, at least in that part of the country. Click here to learn more about Bespoke’s premium stock market research service.
In the month of July, firearm background checks declined by 6.5% sequentially and by 16.6% year over year continuing a recent trend of sharp declines. While checks are down, it followed a period of surging demand in 2020 as geopolitical unrest ran rampant throughout the US (BLM protests, claims of election fraud, COVID lockdowns, etc.). Nonetheless, background checks have declined by 33.9% on a two-year stack.

However, background checks are still in a longer-term uptrend. At 2.4 million, July’s background checks rank in the 16.2% of all months since NICS began reporting this data in 1998, and outside of late 2019 and into early 2021, there were only a few months that the number of checks was higher. Still, they are down 48.8% from the all-time high in March 2021. This may be because demand was pulled forward, but it could also be due to a more normalized domestic situation.
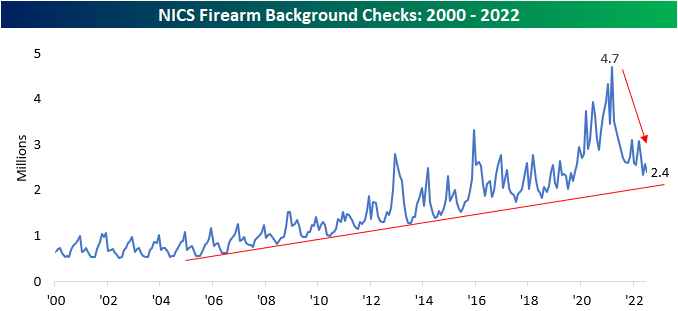
Through July, the 22.4% YTD decline in background checks in July versus December has actually been smaller than average. Background checks in July are practically always lower than in December, and the only year where that wasn’t the case was in 2020 when the country was gripped by riots in cities nationwide. Going back to 2000, background checks in July were typically more than a third (-33.8%) lower than in December. Click here to learn more about Bespoke’s premium stock market research service.

There are two publicly traded stocks directly exposed to these trends: Sturm Ruger (RGR) and Smith & Wesson (SWBI). The monthly performance of these two stocks tends to be highly correlated to trailing twelve-month NCIS background checks, as this is a clear read into the demand picture for these two companies. Just like background checks in general, both stocks are still in sustained downtrends. Click here to learn more about Bespoke’s premium stock market research service.

Rotating in August
Following the best July of the post-WWII era, equities have been getting off to a slower start in August with the Russell 3,000 experiencing a modest decline yesterday and the index fighting to move into the green as of midday today. Most of the move to start August appears to a degree to be rotational in nature. In the chart below, we show the average performance of deciles of Russell 3,000 stocks grouped by their performance in the month of July. As shown, both the best and worst performers last month have rallied in early August with the deciles of the worst performers seeing slightly larger gains. The losers this month have been in the middle of the performance spectrum as deciles 4 through 7 are each flat to lower over the past couple of sessions.

Equities bottomed in mid-June and have been in rally mode ever since. As for how performance the past couple of days relates to the first half of the year’s declines, again the worst performers have generally been outperforming. However, by this measure, the top performers from the 52-week high just after the New Year through the low in June have continued to fall this week. Click here to learn more about Bespoke’s premium stock market research service.
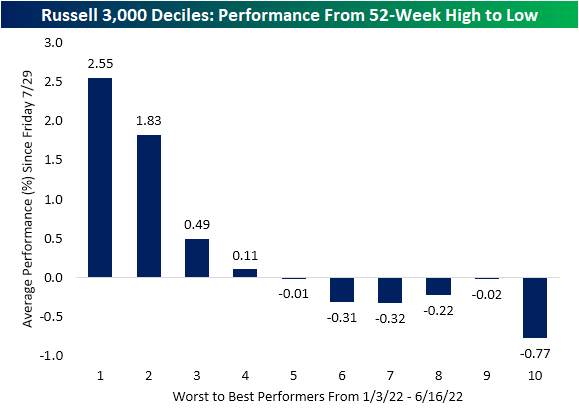
Chart of the Day: Crude Oil Finally Closes Below 200-DMA
Bespoke’s Morning Lineup – 8/2/22 – Oil’s Not Well
See what’s driving market performance around the world in today’s Morning Lineup. Bespoke’s Morning Lineup is the best way to start your trading day. Read it now by starting a two-week trial to Bespoke Premium. CLICK HERE to learn more and start your trial.
“The more you sweat in peace, the less you bleed in war.” – Norman Schwarzkopf

Below is a snippet of content from today’s Morning Lineup for Bespoke Premium members. Start a two-week trial to Bespoke Premium now to access the full report.
With Speaker Pelosi reportedly en route to Taiwan as we type this, markets are on edge this morning as China has threatened military action if the planned trip takes place. Only Chinese authorities know exactly what the response will be, but we would expect more bluster than bite. After a relatively slow day of earnings news yesterday, today will be a busy day, and there have already been a number of important reports this morning from the likes of Caterpillar (CAT), Uber (UBER), and Marriot (MAR) among others. After the close, among others, we’ll hear from AMD, Gilead (GILD), Occidental (OXY), PayPal (PYPL), and Starbucks (SBUX).
Today’s Morning Lineup discusses earnings news out of Europe and the Americas, the rate hike in Australia, a detailed look at other economic data from around the world, and much more.
32 years ago today, Iraq invaded Kuwait, spurring a monumental surge in oil prices. In the first five trading days of August alone, WTI surged more than 35% and nearly doubled in price through the fall as tensions in the region boiled over. There are still more than enough geopolitical issues around the globe today to worry about, but unlike in August 1990, crude oil prices have been moving in the opposite direction.
After briefly trading above $130 per barrel earlier this year, crude oil has declined nearly 30% from its peak to under $95 per barrel, and just yesterday, closed below its 200-DMA for the first time in over six months.

As shown in the chart below, yesterday’s close below the 200-DMA ended what was the 12th longest streak of consecutive closes above the 200-DMA for WTI since the early 1980s. The streak that just ended was the longest since the 269 trading day streak that ended last November. That streak was the third longest on record trailing only the 276 trading day streak that ended in April 2000 and the 330 trading day streak that ended in August 2008.

Start a two-week trial to Bespoke Premium to read today’s full Morning Lineup.
Daily Sector Snapshot — 8/1/22
Bespoke Market Calendar — August 2022
Please click the image below to view our August 2022 market calendar. This calendar includes the S&P 500’s average percentage change and average intraday chart pattern for each trading day during the upcoming month. It also includes market holidays and options expiration dates plus the dates of key economic indicator releases. Click here to view Bespoke’s premium membership options.

Bespoke’s Matrix of Economic Indicators – 8/1/22
Our Matrix of Economic Indicators provides a concise summary analysis of the US economy’s momentum. We combine trends across the dozens and dozens of economic indicators in various categories like manufacturing, employment, housing, the consumer, and inflation to provide a directional overview of the economy.
To access our newest Matrix of Economic Indicators, start a two-week free trial to either Bespoke Premium or Bespoke Institutional now!
Gas Prices Continue to Decline
In 2022, extremely elevated gas prices have been impacting the economy, as every product-producing company has seen energy and transportation costs increase, forcing price hikes on the part of businesses simply to keep margins flat. Although there are a variety of factors affecting CPI readings, high gas prices certainly apply upward pressure. Today, gas prices are still extremely elevated compared to historical levels. At the AAA current national average of $4.22, just 1.8% of all days since the start of 2005 have seen a higher national average high, and all of them occurred this year. Click here to learn more about Bespoke’s premium stock market research service.

The national average price per barrel is still up 32.75% y/y, but this is actually the smallest y/y increase so far in 2022 and comes as the national average price has declined for 48 consecutive days. That’s the fourth longest streak on record. This streak is certainly notable, but gas prices are still at a level that is wearing on consumers.

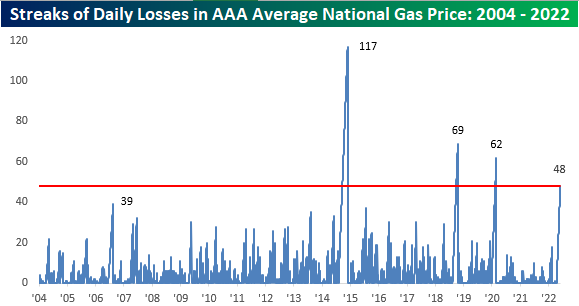
The 40-day rate of change in average gas prices (-15%) has been notable as well, with only six other periods seeing a larger decline on a percentage basis. The most recent occurred during the COVID crash when it became clear that demand was going to deteriorate due to government-imposed mandates across the globe. Consumers will hope for further declines as we begin to near the $4.00 per gallon level. Not only have prices been falling lately, but they have also been more volatile than usual, as the current 50-day standard deviation (26 cents) is 3.2 times higher than the average since 2005. Click here to learn more about Bespoke’s premium stock market research service.

Chart of the Day – 1% Three-Peat
Strongest July in Post-WWII Era
On Friday, the S&P 500 closed over 140 basis points higher on the back of favorable earnings from Apple (AAPL), Amazon (AMZN), Chevron (CVX) and Exxon (XOM). This was the third straight day in which the S&P 500 gained at least one percent, allowing bulls to breathe a sigh of relief after a tough start to the year. These moves came even as a second consecutive quarter of negative real GDP growth was reported and the Fed hikes rates by 75 basis points.
Friday’s move helped the S&P 500 post its best July in the post-WWII era, finishing with a gain of 9.2%. Although the index is still close to 14% off of its early January highs, the market looks more inviting than it did at the beginning of the month, when the YTD declines were above 20%. As investors, we could just give ourselves high fives for the month, but it’s vital to remain forward-looking. Following July gains of 5%+, the S&P 500 has averaged a gain of 0.6% in August (median: +1.4%), performing positively 60 percent of the time. Between the start of August and the end of the calendar year, the index has averaged a gain of 8.0% (median: +10.0%), gaining 80% of the time. Over the following twelve months (starting in August), the index has averaged an impressive gain of 15.6% (median: +15.4%), rallying 87% of the time. Based on past history, bull runs in July tend to bode well for the market for both the rest of the year and over the following twelve months. Click here to learn more about Bespoke’s premium stock market research service.
