Big Bounce in Claims…Or Is It?
Following a few months of downward trending initial jobless claims bringing the indicator back down around multi-decade lows, there has finally been a significant uptick. Whereas last week’s reading was revised lower to an even more impressive 190K (the lowest since April), the latest print soared 29K to 219K. That is only the highest level since the end of August, but it also is back in the range of pre-pandemic readings while also marking the largest week over week increase in claims since the first week of June.

On a non-seasonally adjusted basis, claims rose as might have been expected for the current week of the year. As shown in the second chart below, as far as consistency of week-over-week increases go, the current week of the year is tied with the 2nd and 45th (approximately the weeks of January 8th and November 5th) for fourth as claims have risen 85.5% of the time since 1967. Additionally, before seasonal adjustment, it was not a particularly large increase as the 13.3K WoW rise was half of the average for the comparable week of the year. Even after that increase, unadjusted claims have only been lower during the year’s comparable week twice: 1968 and 1969. In other words, a drift higher in claims is normal at this point of the year, and even with that move higher, claims remain nothing short of impressive.

As for continuing claims which are lagged an additional week to the initial claims number, the latest week saw a modest increase of 15K to 1.361 million. That snapped a streak of four consecutive weeks of declines. Whereas seasonally adjusted initial claims have risen back into the pre-pandemic range, continuing claims have only experienced a modest move higher and are well below their own levels from pre-pandemic years.

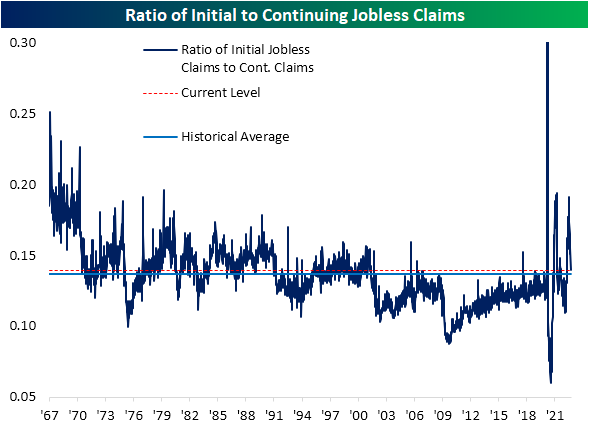
In the past few months, we have consistently checked in on the ratio of initial jobless claims to continuing claims (both seasonally adjusted) as a measure of the lack of follow-through of the former to the latter. With last week’s very strong initial claims number that was more reflective of the still strong continuing claims number, that ratio has now come back in line with the historical average. Click here to learn more about Bespoke’s premium stock market research service.
S&P 500 Sector Weightings Report – October 2022
Bespoke’s Morning Lineup – 10/6/22 – Focus Turns to Jobs
See what’s driving market performance around the world in today’s Morning Lineup. Bespoke’s Morning Lineup is the best way to start your trading day. Read it now by starting a two-week trial to Bespoke Premium. CLICK HERE to learn more and start your trial.
“I hope to let every citizen know what steps he can take without delay to protect his family in case of attack.” – John F. Kennedy

Below is a snippet of content from today’s Morning Lineup for Bespoke Premium members. Start a two-week trial to Bespoke Premium now to access the full report.
The focus for the rest of the week will be on jobs and Fedspeak with jobless claims today (higher than expected) and the September jobs report coming out tomorrow. In addition to the hard data, there are at least seven Fed speakers scheduled to speak between now and the end of the trading week. Last night, Atlanta Fed President Raphael Bostic was relatively hawkish when he noted that the fight against inflation was still in its ‘early days’ and sees the Fed Funds rate rising to around 4.5% by the end of the year and then from there the Fed should assess where the economy is heading. The path of a hike to 4% or 4.5% and then a pause (rather than a pivot) from there seems to be the Fed’s ‘plan’ at this point.
Investor sentiment this week improved after the market’s rally but with bullish sentiment still below 24% sentiment remains extremely depressed. There’s still a lot going wrong these days. The prices we’re paying for everything remain higher than we could have ever imagined, relations with China and Russia haven’t been this strained in a generation, a major hurricane just decimated parts of one of the country’s largest states, and by some measures, Americans have never been more miserable. It stinks out there.
But if you think you have it bad now, we’ve been here before, and it’s been even worse. Consider yourself lucky that Joe Biden isn’t on TV or TikTok today with a hammer and nails giving you a step-by-step guide on how to build a bomb shelter in the event of a nuclear attack. That may sound farfetched, but that’s where we were just 51 years ago today when President Kennedy made the comments above in a speech on the threats of an attack. And this was a full year before the Cuban Missile Crisis. The current geo-political backdrop is far from stable these days, but at least we’re not all learning to build bomb shelters in our basements or know at least where the closest Fallout Shelter is. Some of you out there may even remember firsthand or through stories from your parents of drills where they would get under their desks in order to protect themselves from nuclear fallout. A lot of good that would have done.
What a difference a few days can make in the markets. Equities around the world are gingerly easing themselves out of the bunker from weeks of declines that brought them into oversold territory. Just over a week ago, on September 27th, every regional equity ETF with the exception of the Latin America ETF (ILF) that we track in our Trend Analyzer tool was in extreme oversold territory, and all but two had been down at least 5% over the prior five trading days. Six were even down over 7%.

Fast forward to the present and every one of these same ETFs has now notched gains over the last week and each one of them has moved out of ‘extreme’ oversold territory. They’re still oversold and only ILF is not down by double-digit percentages YTD, but you have to start somewhere. As we noted in Wednesday’s quote of the day, “When nobody wants something, that creates an opportunity.” Nobody wanted anything to do with stocks – or for that matter, any other asset – as the third quarter ended last week. Investors have hardly fallen back in love with equities again, but they left a pillow on the couch and the back door unlocked.

Our Morning Lineup keeps readers on top of earnings data, economic news, global headlines, and market internals. We’re biased (of course!), but we think it’s the best and most helpful pre-market report in existence!
Start a two-week trial to Bespoke Premium to read today’s full Morning Lineup.
Daily Sector Snapshot — 10/5/22
Oil and Stocks Mix It Up
Like oil and water, oil and stock prices generally don’t mix. A big jump in oil prices usually leads to lower stock prices, while stock prices often experience a boost when oil prices decline. That’s what makes the performance of both to start the week so interesting with the S&P 500 up over 5% week to date through Tuesday’s close while oil prices surged nearly 9% during that same span.
In the case of oil prices, two-day rallies of the magnitude we saw through Tuesday’s close have been common going back to the start of 1984 which is as far back as we have full-year data on a daily basis. You could even say that moves of this magnitude have been relatively common.

Two-day rallies in equity prices of the magnitude seen this week haven’t been nearly as common, but we wouldn’t call them rare either. Besides this week, there have been 23 other times since 1984 when the trailing two-day performance of the S&P 500 was greater than this week’s two-day rally.
Where things really start to get much less common is when both the S&P 500 and crude oil prices rally 5% or more at the same time. That has only happened six other times since 1984, and prior to 2008, it had never happened before. The chart below shows the S&P 500 since 2007 with the red dots showing every day that both the S&P 500 and crude oil rallied 5%+ over a two-day span. Four of those occurrences came during and coming out of the Financial Crisis, another was in August 2015 when China devalued the yuan, and the most recent occurrence before this week was right after the COVID crash lows. With the exception of the first occurrence right after Lehman’s bankruptcy in September 2008, every one of the other occurrences came either in the later stages of a bear market or coming out of a significant decline, and what they all have in common is that they occurred during periods of severe market dislocations.

One aspect of the first occurrence in September 2008 that has bears salivating is that the S&P 500’s pattern leading up to that occurrence looks very similar to the pattern now, and in each case was down by similar amounts from all-time highs (19.2% in September 2008 and 20.7% as of Tuesday’s close). Additionally, in both cases, the bounce came shortly after the S&P 500 broke below a prior low. Looking more closely at the two periods and overlaying them on top of each other, though, besides the fact that the S&P 500 was down sharply in the year leading up to both periods, the patterns don’t look all that similar after all and the correlation between closing prices is just 0.63. Click here to learn more about Bespoke’s premium stock market research service.

Chart of the Day: Take the Long View After Short-Term Swings
Bespoke’s Morning Lineup – 10/5/22 – Giving Back
See what’s driving market performance around the world in today’s Morning Lineup. Bespoke’s Morning Lineup is the best way to start your trading day. Read it now by starting a two-week trial to Bespoke Premium. CLICK HERE to learn more and start your trial.
“When nobody wants something, that creates an opportunity.” – Carl Icahn
Below is a snippet of content from today’s Morning Lineup for Bespoke Premium members. Start a two-week trial to Bespoke Premium now to access the full report.
Equity futures are giving back much of yesterday afternoon’s gains and treasury yields are higher as markets reverse some, but certainly not all, of the moves from the last two trading days. ADP Private Payrolls increased 208K in September which was slightly above the consensus forecast of 200K. Oil is down marginally today ahead of an expected production cut announcement today, but crude rallied over 8% to start the week in anticipation of today’s decision. Overnight and this morning, we’ve seen the release of Services PMIs for a number of countries, and the general trend was of sequential declines suggesting that economic momentum continues to wane.
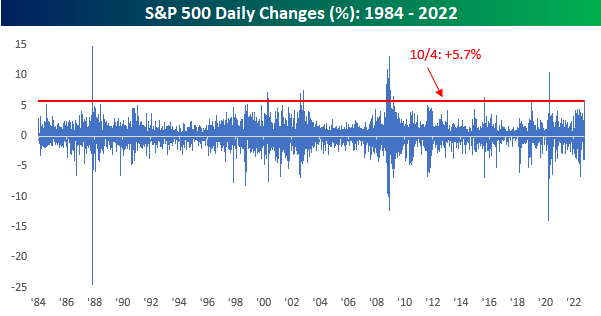
The S&P 500 rallied 5.7% in the first two trading days of the week, and while large, moves of this magnitude haven’t been unprecedented, and looking back over the last 50 years, there have been more than 30 other two-day rallies of 5%+. This week’s move was the largest since April 2020 and we saw a number of similar moves in the weeks coming off the COVID lows. Between those occurrences and the Financial Crisis, there was one occurrence in late 2018 and another in August 2015.

The red dots in the chart below indicate every prior day where the two-day trailing return of the S&P 500 was 5% or more. In recent years, a number of these occurrences came right or near market lows, but over the longer term, they have sprung up in all sorts of market environments like near market tops, early in a downturn, near market lows, or in the early stages of new bull markets. In other words, their level of significance is debatable.

Our Morning Lineup keeps readers on top of earnings data, economic news, global headlines, and market internals. We’re biased (of course!), but we think it’s the best and most helpful pre-market report in existence!
Start a two-week trial to Bespoke Premium to read today’s full Morning Lineup.