Quotes From August Earnings
Heading into a weekend when everyone is focused on commentary out of Jackson Hole, we decided to go a different direction. Today we are highlighting some of the most interesting quotes from earnings releases and conference calls during the month of August. We picked out the quotes from our Conference Call Recaps that provide insight into either the broader economy or specific industries. Click here to start a two-week trial to Bespoke Premium and receive our paid content in real-time.
Overall, company commentary suggests that the consumer is generally strong, but purchasing patterns have changed due to higher gas prices, inflation, and shifting consumer activities. On the corporate side, a number of tech companies have made note of the fact that business has softened as the economy is now on the backend of the COVID demand pull forward.
August ’22 Earnings Quotes:
Uber (UBER) CEO Dara Khosrowshahi noted: “Driver engagement reached another post-pandemic high in Q2, and we saw an acceleration in both active and new driver growth in the quarter. Against the backdrop of elevated gas prices globally, this is a resounding endorsement of the value drivers continue to see in Uber.” This might be due to the higher cost of living brought forth by the inflationary environment.
UBER’s management team saw “Delivery demonstrated stable consumer, merchant, and courier metrics against tough YoY comps as COVID-19 restrictions continued to ease around the world.”
Starbucks (SBUX) is still seeing “strength in customer demand globally,” according to CEO Howard Shultz.
“We are not currently seeing any measurable reduction in customer spending or any evidence of customers trading down, reflecting the strength of the Starbucks brand, deep customer engagement and loyalty, pricing power, and the premium nature of our beverage and food offerings.” – Shultz
Tyson Foods (TSN) CEO Donnie King noted that “increasing consumer demand for protein remains relatively steady.” However, consumer demand is being impacted by “a challenging macroeconomic environment.”
Walmart (WMT) CEO Doug McMillon noted: “We expect inflation to continue to influence the choices that families make, and we’re adjusting to that reality so we can help them more.”
CFO David Rainey is seeing consumers trade down “in terms of quality and quantity… Clearly, they’re stressed from higher gas prices, higher food prices, and even housing.” Click here to start a two-week trial to Bespoke Premium and receive our paid content in real-time.
Target (TGT) Chief Growth Officer Christina Hennington commented that, although consumer spending power appears to remain strong, “confidence in their personal finances continues to wane.” Hennington also added that “difficult news headlines, COVID surges, and continued political volatility” had a negative impact on consumer confidence as well.
Home Depot (HD) CEO Ted Decker noted “continued strength in demand for home improvement projects,” which is likely supplementing a decline in new home activity.
PayPal (PYPL) CFO Gabrielle Rabinovitch commented: “we’re closely monitoring the impact of high inflation on economic growth, consumer demand, and sentiment, as well as broader global macroeconomic indicators. The backdrop continues to be complex, and we’re taking an appropriately prudent approach to managing our business.”
Alibaba (BABA) still sees “supply chain and logistics disruptions” due to China’s COVID-zero policy. However, the company did see improvement towards the end of the quarter. CEO Daniel Zhang saw “signs of recovery since June as logistics and the supply chain situation gradually improved after COVID restrictions eased.”
Coinbase (COIN) CEO Brian Armstrong said, “you have to really remember that crypto is not linear. Any given quarter could be up or down or even any given year. But if you evaluate the business across price cycles, it tells a much different story.”
“The future of all media is digital and programmatic, eventually all media will be digital, and it will be transacted by machines,” according to The Trade Desk’s (TTD) press release.
Zoom (ZM) lowered guidance due to FX headwinds, weak online sales, and “to a lesser extent backend linearity,” as per CFO Kelly Steckelberg.
Cisco (CSCO) CEO Chuck Robbins commented: “While we anticipated some moderation from the unprecedented product order growth of last year, demand signals remain solid.”
Advanced Micro Devices (AMD) CEO Lisa Su noted that “there has been additional softness in the PC market in recent months.”
NVIDIA (NVDA) CFO Colette Kress added: “we have likely under-shipped gaming to our end demand significantly… we do have gaming growth drivers to consider for the future.” Click here to start a two-week trial to Bespoke Premium and receive our paid content in real-time.
“The next wave of computing is coming. With AI and 3D graphic advances, developers will extend the internet with virtual world overlays that connect to the physical world,” as per CEO Jensen Huang.
Salesforce (CRM) Co-CEO Bret Taylor noted that the company is “seeing [gross merchandise value] decelerate in line with the rest of the e-commerce industry as consumers settle back down to pre-pandemic norms.”
To gain access to our full Conference Call Recaps in real time, start a 14-day trial to our Institutional package.
Bespoke’s Morning Lineup – 8/26/22 – Going Back to the (Po) Well
See what’s driving market performance around the world in today’s Morning Lineup. Bespoke’s Morning Lineup is the best way to start your trading day. Read it now by starting a two-week trial to Bespoke Premium. CLICK HERE to learn more and start your trial.
“There is no risk-free path for monetary policy.” – Jerome Powell

Below is a snippet of content from today’s Morning Lineup for Bespoke Premium members. Start a two-week trial to Bespoke Premium now to access the full report.
Futures have been digging out of their hole all morning, but still remain in negative territory ahead of Powell’s speech in Jackson Hole at 10 AM. Crude oil is modestly higher this morning while US Treasury yields are modestly lower. Outside of the Fed, one big story crossing the wires right now is from Bloomberg which is reporting that the US and China have reached a preliminary deal regarding audits that could avoid delistings of Chinese companies from US exchanges.
It’s also a busy morning for economic data, and for the 8:30 batch, Personal Income and Spending were both weaker than expected, but PCE inflation data came in weaker than expected. At 10 AM, we’ll get the Michigan Confidence report which will be interesting to watch as it will come out just as Powell starts speaking.
Ahead of Powell’s widely anticipated speech today, the equity market is following the technical playbook to a tee. After stalling out just short of its 200-DMA last week, the pullback that followed found support right at the June highs and the brief period of consolidation that occurred right before the August rally run to the 200-DMA. While not necessarily a technical term, the saying, “if at first, you don’t succeed, try again”, seems applicable to where the market is today relative to its 200-DMA. Now, we just have to wait to see if Powell’s speech will provide some fuel for that attempt or put on the brakes. We’ll know within the next couple of hours.

Our Morning Lineup keeps readers on top of earnings data, economic news, global headlines, and market internals. We’re biased (of course!), but we think it’s the best and most helpful pre-market report in existence!
Start a two-week trial to Bespoke Premium to read today’s full Morning Lineup.
Bespoke’s Weekly Sector Snapshot — 8/25/22
Sentiment Slide
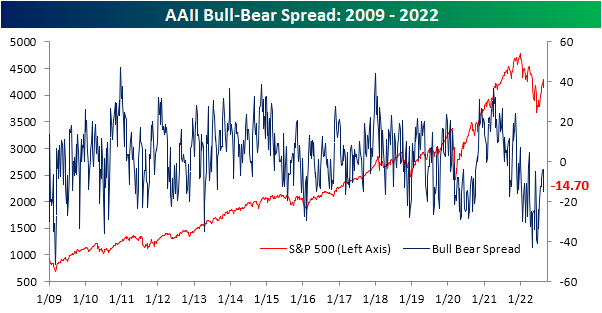
With the S&P 500 pivoting lower in the past week, sentiment has reflected the move as the AAII sentiment survey showed bullish sentiment drop from 33.3% last week down to 27.7%. That marked the first time bullish sentiment fell in three weeks, and it was the largest single-week decline since an eleven percentage point drop the week of June 9th.

Bearish sentiment picked up the bulk of that decline as the reading topped 40% for the first time since the last week of July. At 42.4%, it is at the highest level since July 14th. Although that marks a shift toward more pessimistic sentiment, reversing a trend of improvement from the past few weeks, the current reading on bearish sentiment is well below the highs from throughout the spring and early summer.

Nonetheless, after coming within only a few points of a positive reading in the past month, the bull-bear spread took a sharp turn lower as a result of this week’s results. The spread fell to -14.7 which is the lowest reading since July 14th. That was also the first double-digit week-over-week drop in the reading since June. Additionally, with a move deeper into negative territory, the spread is a week away from becoming tied for the second-longest streak of negative readings on record. Click here to learn more about Bespoke’s premium stock market research service.

Claims’ Seasonal Low Draws Near
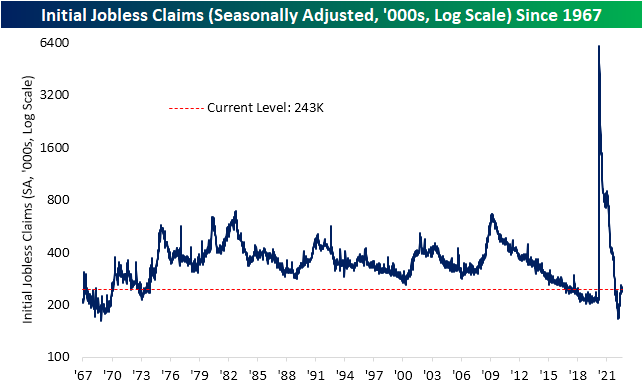
Initial jobless claims have come well off of the historic lows from earlier this year, but the past couple of weeks have also seen modest improvements. We’ve now seen back-to-back weeks of declines in claims for a total drop of 9K, leaving seasonally adjusted initial claims at 243K. That is the lowest reading since the week of July 22nd. However, that is still above the range from the two years prior to the pandemic.
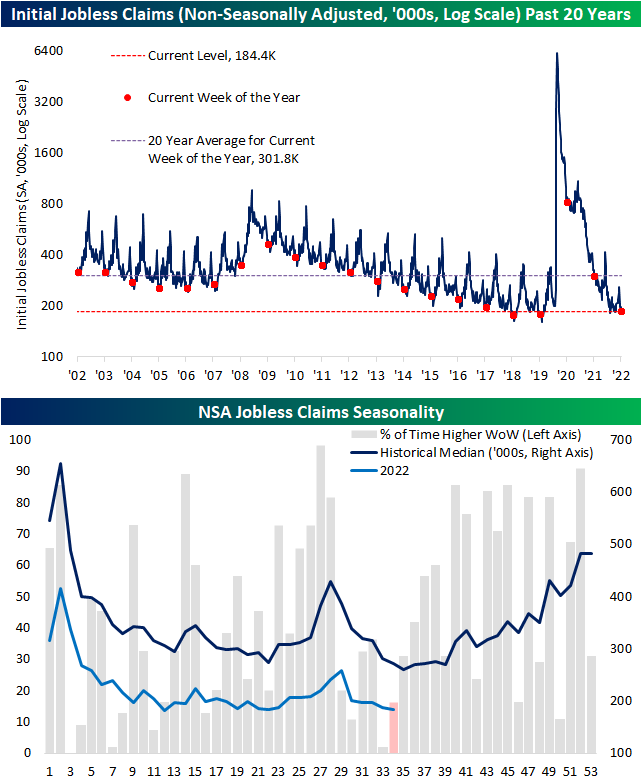
Non-seasonally adjusted claims are nearing what is typically an annual low. The past couple of weeks have historically been two that have seen the most consistent declines on a week-over-week basis throughout the year. That has dropped NSA claims to 184.4K which is only slightly above the post-pandemic low of 183.6K from the final week of May.
Continuing claims came in lower than expectations this week dropping to 1.415 million versus forecasts for an increase to 1.441 million. Overall, continuing claims remain much stronger and less elevated off the lows than initial claims. Whereas initial claims are above their pre-pandemic range, current levels of continuing claims continue to come in at some of the lowest levels since the first few years of the data.

Given this, the ratio of initial to continuing claims continues to hover at levels that are well above the norm of the past few decades even after peaking last month. That would imply healthy turnover as those who are filing for unemployment are not remaining unemployed for long given the small amount of follow-through of initial claims into continuing claims. Click here to learn more about Bespoke’s premium stock market research service.

LIKS Report: 8/25/22
Bespoke’s Little Known Stocks (LIKS) report highlights a company that may not be on the traditional radar of most investors. In this report, we provide an in-depth analysis of the little known stock, including industry insights, growth lever analysis, insights to the competitive landscape, equity performance, relative valuation, operational efficiency, pros & cons, and more. Today’s report is about a company that helps governments and enterprises defend their cyber assets.

As always, this report is for informational purposes only and is not a recommendation to buy or sell any specific securities. Investors should do their own research and/or work with a professional when making investment decisions. Highlighting a stock doesn’t mean we are bullish or bearish on it. Our goal is simply to provide readers with facts to help them make informed decisions rather than just opinions.
Bespoke’s LIKS reports are available at the Bespoke Institutional level only. You can sign up for Bespoke Institutional now and receive a 14-day trial to read our LIKS reports. To sign up, choose either the monthly or annual checkout link below:
Chart of the Day: Jackson Hole Trends
Bespoke’s Morning Lineup – 8/25/22 – Mountain Jam
See what’s driving market performance around the world in today’s Morning Lineup. Bespoke’s Morning Lineup is the best way to start your trading day. Read it now by starting a two-week trial to Bespoke Premium. CLICK HERE to learn more and start your trial.
“It’s hard to live your life in color, and tell the truth in black and white.” – Gregg Allman
Below is a snippet of content from today’s Morning Lineup for Bespoke Premium members. Start a two-week trial to Bespoke Premium now to access the full report.
We’re still a full day from Powell’s Jackson Hole speech, but futures have shown some resilience this morning indicating a positive start to the trading day. Interest rates are little changed but slightly biased to the upside. It’s a busy day for economic data for jobless claims, GDP, Personal Consumption, and Core PCE all at 8:30 with the KC Fed Manufacturing report coming out at 11 AM. The 8:30 data was just released and Jobless Claims came in lower than expected on both an initial and continuing basis. The revision to Q2 GDP came in at a decline of 0.6% which was slightly less worse than forecasts for a decline of 0.7%. Personal Consumption came in right in line with forecasts at 1.5% while Core PCE was 4.4% which was in line with consensus forecasts. All in all not much in the way of big surprises.
As investors gnaw on their fingernails in anticipation of Friday’s Powell speech in Jackson Hole, they remain anxious about the direction of interest rates. The yield on the 10-year US Treasury has gone from a multi-year high of just under 3.5% in late June down to 2.57% in early August. Since that low, yields have rocketed higher and closed yesterday at 3.10% which is right around the same levels they temporarily peaked at in the Spring. If yields continue higher in the coming days, a run to new highs will seem like a foregone conclusion which would act as a headwind for risk assets, but if yields start to stall out here, the chart of the 10-year yield will look more like a head and shoulders and provide a sigh of relief.

The two-year yield is another story. Just yesterday, the yield finished the day right at 3.39% which was just four basis points (bps) below its June 14th high. Like the 10-year, the direction of the 2-year yield in the coming days will likely play a big role in the stock market narrative for weeks to come.

Whichever way yields move, the 10-year/2-year Treasury yield curve remains firmly entrenched at inverted levels and is one of an increasingly growing number of indicators out there suggesting that the economy is either on the verge of or already in a recession.

Our Morning Lineup keeps readers on top of earnings data, economic news, global headlines, and market internals. We’re biased (of course!), but we think it’s the best and most helpful pre-market report in existence!
Start a two-week trial to Bespoke Premium to read today’s full Morning Lineup.
The Bespoke 50 Growth Stocks — 8/25/22
The “Bespoke 50” is a basket of noteworthy growth stocks in the Russell 3,000. To make the list, a stock must have strong earnings growth prospects along with an attractive price chart based on Bespoke’s analysis. The Bespoke 50 is updated weekly on Thursday unless otherwise noted. There were no changes to the list this week.
The Bespoke 50 is available with a Bespoke Premium subscription or a Bespoke Institutional subscription. You can learn more about our subscription offerings at our Membership Options page, or simply start a two-week trial at our sign-up page.

The Bespoke 50 performance chart shown does not represent actual investment results. The Bespoke 50 is updated weekly on Thursday. Performance is based on equally weighting each of the 50 stocks (2% each) and is calculated using each stock’s opening price as of Friday morning each week. Entry prices and exit prices used for stocks that are added or removed from the Bespoke 50 are based on Friday’s opening price. Any potential commissions, brokerage fees, or dividends are not included in the Bespoke 50 performance calculation, but the performance shown is net of a hypothetical annual advisory fee of 0.85%. Performance tracking for the Bespoke 50 and the Russell 3,000 total return index begins on March 5th, 2012 when the Bespoke 50 was first published. Past performance is not a guarantee of future results. The Bespoke 50 is meant to be an idea generator for investors and not a recommendation to buy or sell any specific securities. It is not personalized advice because it in no way takes into account an investor’s individual needs. As always, investors should conduct their own research when buying or selling individual securities. Click here to read our full disclosure on hypothetical performance tracking. Bespoke representatives or wealth management clients may have positions in securities discussed or mentioned in its published content.