B.I.G. Tips – Utilities Lose Power
Bespoke’s Morning Lineup – 10/7/22 – Warm Jobs Report
See what’s driving market performance around the world in today’s Morning Lineup. Bespoke’s Morning Lineup is the best way to start your trading day. Read it now by starting a two-week trial to Bespoke Premium. CLICK HERE to learn more and start your trial.
“You never know what those Cumberland players have up their sleeve” – John Heisman

Below is a snippet of content from today’s Morning Lineup for Bespoke Premium members. Start a two-week trial to Bespoke Premium now to access the full report.
The above comment was made by coach Heisman during halftime of a game on this day in 1916 when Georgia Tech was beating Cumberland University by a score of 126-0. Bulls are this year’s Cumberland University as financial assets of all types are in the red YTD, and the classic 60/40 portfolio is having its worst year on record. This week, they’ve seen a faint glimmer of hope even as the Fed keeps turning up the heat, but it remains to be seen if they can chip away at the bears’ lead. After taking a 126-point lead at the half, Georgia Tech went on to win 222-0 in what was the most lopsided college football game of all time. The bulls can only hope the next three months don’t play out like the second half of Georgia Tech vs Cumberland and make 2022 one of the most-lopsided years in terms of downside stock market performance.
Today’s employment report isn’t going to help the bull’s cause. While Non-Farm Payrolls only surpassed expectations by 8K (263K vs 255K), the Unemployment Rate came in at 3.5% versus forecasts for an increase to 3.7%. Futures, which were higher heading into the report, have reversed those gains and are now indicated modestly lower.
When the economy was cratering during the early days of COVID, once the Federal Reserve and Congress stepped in with massive stimulus, markets looked right through the weakness and rallied. Two years later, we’ve done a 180. Heading into today’s Non-Farm Payrolls (NFP) report for September, seven of the eight reports for 2022 have come in better than expected. Over the course of these eight reports, the initially reported reading was an average of 133K greater than consensus forecasts. That may not sound like a lot, but prior to COVID, there were only six other NFP reports out of 262 where the actual reported reading exceeded consensus forecasts by more than that amount.
Even as the US employment situation has outperformed expectations this year by an unprecedented margin, stocks haven’t liked it one bit. The table below lists the date of each NFP report this year and summarizes how the initial reading came in relative to expectations along with how the S&P 500 performed on the day (using SPY as a proxy). Of the seven NFP reports that came in better than expected, the S&P 500 gapped lower by an average of 0.48% and finished the day down by an average of 0.55% six out of seven times. The economy may be doing OK, but once again, the market is looking right through it to one of the most aggressive tightening cycles by the Federal Reserve investors have ever seen.

Our Morning Lineup keeps readers on top of earnings data, economic news, global headlines, and market internals. We’re biased (of course!), but we think it’s the best and most helpful pre-market report in existence!
Start a two-week trial to Bespoke Premium to read today’s full Morning Lineup.
Bears Remain Above 50%
The past week’s rebound in equity prices has bolstered sentiment a bit as the latest AAII survey showed an increase in bullishness. For the second week in a row, bullish sentiment rose week over week to come in at 23.9%. That is, of course, still below the reading of 26.1% only three weeks ago and even further depressed relative to the historical average.
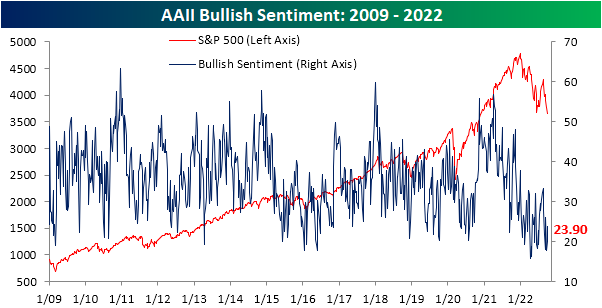
The pickup in bullish sentiment borrowed from bears. After two consecutive weeks of readings above 60% (the first such occurrence in the history of the survey), bearish sentiment has turned lower falling to 54.8%. As with bullish sentiment, that marks some improvement, but much more progress would need to be made to bring bearish sentiment back in line with the historical average of 30.5%.

Although the streak of readings above 60% is over, more than half of the respondents remain bearish. As shown below, that has grown to be the longest streak of such readings since the depths of the COVID Crash. Prior to that, there have only been six other such streaks: four occurring between 2008 and 2009 and the others occurring in August and October of 1990.

With both bullish and bearish sentiment improving, the bull-bear spread has risen up to -30.9 after hitting the lowest level since 2009 only two weeks ago.

Again, in spite of any improvement, sentiment remains heavily in favor of bears as it has for more than half a year. As shown below, the bull-bear spread has remained negative for 27 weeks in a row. That is the second-longest streak of negative readings on record but would need to continue for another two months to surpass the 2020 record.

Not all of the losses to bearish sentiment went to bulls. Neutral sentiment also rebounded slightly rising from sub-20% (the lowest level since April 2020) to 21.3%. Click here to learn more about Bespoke’s premium stock market research service.

The Bespoke 50 Growth Stocks — 10/6/22
The “Bespoke 50” is a basket of noteworthy growth stocks in the Russell 3,000. To make the list, a stock must have strong earnings growth prospects along with an attractive price chart based on Bespoke’s analysis. The Bespoke 50 is updated weekly on Thursday unless otherwise noted. There were no changes to the list this week.
The Bespoke 50 is available with a Bespoke Premium subscription or a Bespoke Institutional subscription. You can learn more about our subscription offerings at our Membership Options page, or simply start a two-week trial at our sign-up page.

The Bespoke 50 performance chart shown does not represent actual investment results. The Bespoke 50 is updated weekly on Thursday. Performance is based on equally weighting each of the 50 stocks (2% each) and is calculated using each stock’s opening price as of Friday morning each week. Entry prices and exit prices used for stocks that are added or removed from the Bespoke 50 are based on Friday’s opening price. Any potential commissions, brokerage fees, or dividends are not included in the Bespoke 50 performance calculation, but the performance shown is net of a hypothetical annual advisory fee of 0.85%. Performance tracking for the Bespoke 50 and the Russell 3,000 total return index begins on March 5th, 2012 when the Bespoke 50 was first published. Past performance is not a guarantee of future results. The Bespoke 50 is meant to be an idea generator for investors and not a recommendation to buy or sell any specific securities. It is not personalized advice because it in no way takes into account an investor’s individual needs. As always, investors should conduct their own research when buying or selling individual securities. Click here to read our full disclosure on hypothetical performance tracking. Bespoke representatives or wealth management clients may have positions in securities discussed or mentioned in its published content.
Bespoke’s Weekly Sector Snapshot — 10/6/22
Bespoke’s Consumer Pulse Report — October 2022
Chart of the Day: Long Around the 200-DMA
September 2022 Headlines
Big Bounce in Claims…Or Is It?
Following a few months of downward trending initial jobless claims bringing the indicator back down around multi-decade lows, there has finally been a significant uptick. Whereas last week’s reading was revised lower to an even more impressive 190K (the lowest since April), the latest print soared 29K to 219K. That is only the highest level since the end of August, but it also is back in the range of pre-pandemic readings while also marking the largest week over week increase in claims since the first week of June.

On a non-seasonally adjusted basis, claims rose as might have been expected for the current week of the year. As shown in the second chart below, as far as consistency of week-over-week increases go, the current week of the year is tied with the 2nd and 45th (approximately the weeks of January 8th and November 5th) for fourth as claims have risen 85.5% of the time since 1967. Additionally, before seasonal adjustment, it was not a particularly large increase as the 13.3K WoW rise was half of the average for the comparable week of the year. Even after that increase, unadjusted claims have only been lower during the year’s comparable week twice: 1968 and 1969. In other words, a drift higher in claims is normal at this point of the year, and even with that move higher, claims remain nothing short of impressive.

As for continuing claims which are lagged an additional week to the initial claims number, the latest week saw a modest increase of 15K to 1.361 million. That snapped a streak of four consecutive weeks of declines. Whereas seasonally adjusted initial claims have risen back into the pre-pandemic range, continuing claims have only experienced a modest move higher and are well below their own levels from pre-pandemic years.

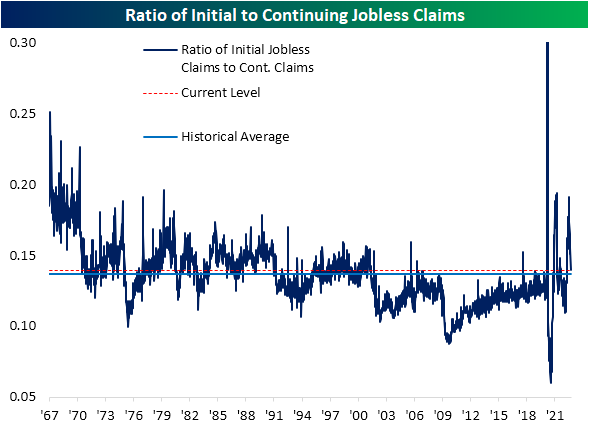
In the past few months, we have consistently checked in on the ratio of initial jobless claims to continuing claims (both seasonally adjusted) as a measure of the lack of follow-through of the former to the latter. With last week’s very strong initial claims number that was more reflective of the still strong continuing claims number, that ratio has now come back in line with the historical average. Click here to learn more about Bespoke’s premium stock market research service.