B.I.G. Tips – Wild Intraday Swings Continue
Daily Sector Snapshot — 1/27/22
The Bespoke 50 Growth Stocks – 1/27/22
The “Bespoke 50” is a basket of noteworthy growth stocks in the Russell 3,000. To make the list, a stock must have strong earnings growth prospects along with an attractive price chart based on Bespoke’s analysis. The Bespoke 50 is updated weekly on Thursday unless otherwise noted. There were ten changes to the list this week.
The Bespoke 50 is available with a Bespoke Premium subscription or a Bespoke Institutional subscription. You can learn more about our subscription offerings at our Membership Options page, or simply start a two-week trial at our sign-up page.

The Bespoke 50 performance chart shown does not represent actual investment results. The Bespoke 50 is updated weekly on Thursday. Performance is based on equally weighting each of the 50 stocks (2% each) and is calculated using each stock’s opening price as of Friday morning each week. Entry prices and exit prices used for stocks that are added or removed from the Bespoke 50 are based on Friday’s opening price. Any potential commissions, brokerage fees, or dividends are not included in the Bespoke 50 performance calculation, but the performance shown is net of a hypothetical annual advisory fee of 0.85%. Performance tracking for the Bespoke 50 and the Russell 3,000 total return index begins on March 5th, 2012 when the Bespoke 50 was first published. Past performance is not a guarantee of future results. The Bespoke 50 is meant to be an idea generator for investors and not a recommendation to buy or sell any specific securities. It is not personalized advice because it in no way takes into account an investor’s individual needs. As always, investors should conduct their own research when buying or selling individual securities. Click here to read our full disclosure on hypothetical performance tracking. Bespoke representatives or wealth management clients may have positions in securities discussed or mentioned in its published content.
Yield Curve Goes Flat
Even as the FOMC is still adding to its balance sheet, hawkish commentary from Powell and company has caused massive moves in the fixed income market resulting in a massive flattening of the yield curve. Today alone, the spread between the yield on the 10-year and 2-year US Treasuries has narrowed by nearly 10 basis points (bps). Even more extreme, is the fact that over the last three months the curve has flattened by more than 50 bps from well over 100 bps to just over 60 bps.
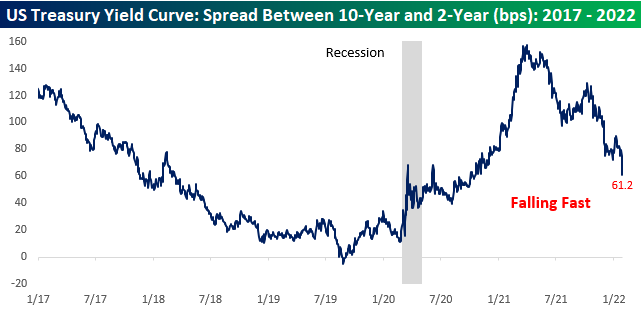
Looking at the three-month rate of change in the yield curve, it hasn’t flattened this fast in at least five years. Last summer, we saw a similar but not as severe of a move.

Taking a longer-term look, flatter yield curves aren’t necessarily a negative economic signal, but there is an inverse relationship between the level of the yield curve and recession concerns i.e., the flatter the curve gets the more the market starts to price in the odds of a recession. As shown in the chart below, every recession since the late 1970s has followed an inversion of the curve.

In terms of the pace of flattening in the 2s10s curve, the current pace has been the swiftest since January 2015, and longer-term, there haven’t been a whole lot of periods where the curve flattened at a faster rate. Looking on the bright side, though, a rapid flattening of the yield curve by itself has not been a siren song for an impending recession. As shown in the chart below, there have been numerous times over the last 40 years where the curve steepened by as much (red line) or more than it has in the last three months and the economy was nowhere near a recession. Click here to view and sign up for Bespoke’s premium membership options.

Extreme Bearish Sentiment
As equities continue to sell off, sentiment continues to tank in a broad sense. That being said, there was actually a higher share of respondents to the AAII survey reporting bullish sentiment this week. Coming off the lowest level since July 2020, bullish sentiment rose slightly and remains historically low at 23.1%.

Bearish sentiment, meanwhile, has surged 22.4 percentage points in the past month with more than half of respondents falling in the bearish camp this week. At 52.9%, it was the highest reading since the week of April 11, 2013. In other words, sentiment this week among survey respondents was more negative than even the COVID Crash. In all weeks since the start of the survey in 1987, there have only been 40 other weeks with as high if not higher of a reading.

Given the massive increase in bearish sentiment, the bull-bear spread has also outright collapsed. At -29.8, bears outnumber bulls by the widest margin again since April 2013.

Given bullish sentiment was actually higher as bears surged, the difference came from a big drop in neutral sentiment. Neutral sentiment fell by 8.4 percentage points to 23.9%. That is only the lowest neutral sentiment reading since the first week of September of last year, but it was the biggest week-over-week decline since November 2020.

The AAII survey was far from being alone in indicating bearish sentiment. The Investors Intelligence survey of newsletter writers saw the most bearish readings since the spring of 2020 and the NAAIM Exposure index also saw one of the more modest readings of the past year. Using all of these readings combined, we created our sentiment composite below to get a more general feel for sentiment across these indicators. This week, that composite fell below -1 meaning on average sentiment indicators are a full standard deviation below (or in a bearish direction) their normal reading. Of course, that was the first time such a reading has been observed since the COVID crash.

With data beginning in 2006, there have only been nine other times in which the sentiment composite has fallen below -1 for the first time in at least three months. In the table below, we show those instances and how the S&P 500 has performed going forward. Overall, that bearish sentiment proves to be correct in the next week as the S&P 500 has declined two-thirds of the time. One month to one year later, though, returns have been biased to the positive side with positive returns at least two-thirds of the time. Click here to view Bespoke’s premium membership options.
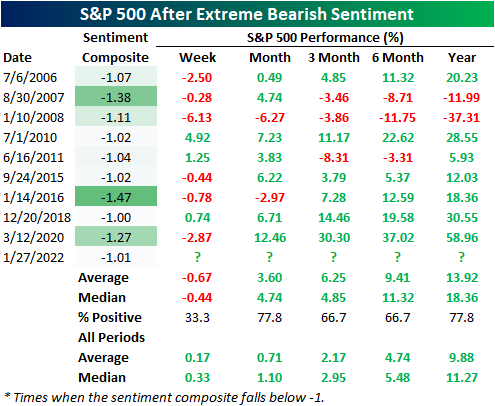
Chart of the Day: Fed Balance Sheet Outlook
Small Improvements in Claims
Initial jobless claims fell to 260K this week after last week’s higher than expected reading that was revised even higher to 286K this week. Claims were expected to drop this week, but the actual decline was 5K larger than forecasts.
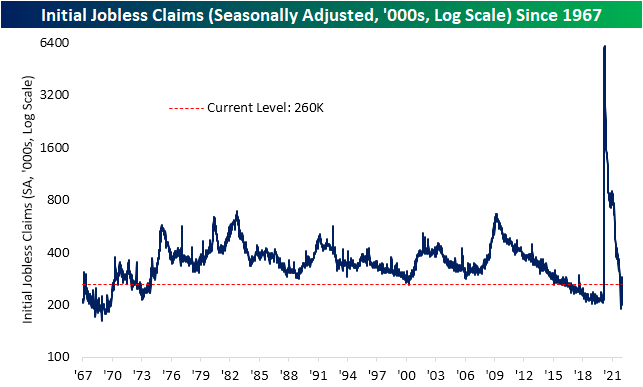
The beginning of the year typically sees a seasonal high in claims which abates into the early spring. In fact, the third (last week) and fourth (this week) weeks of the year are some of the most consistent periods for week over week declines in the NSA number. Specifically, the third week of the year has never seen a WoW increase in the NSA number and the fourth week of the year (this week) has only seen claims rise 9% of the time; the fifth-best of any week of the year.
Given this, last week’s weaker than expected adjusted number was a result of a smaller than normal decline in NSA claims. This week’s drop of 73.3K to 267.6K was again smaller than normal, but much closer to the historical average of a 76.5K decline. In other words, the actual drop in claims before seasonal adjustment continues to be weaker than normal for this point of the year potentially as a result of high COVID case counts. Regardless, the actual level of claims for the current week of the year is basically right in line with the average from the few years prior to the pandemic.

Continuing claims are delayed an extra week to the initial claims number making the most recent print through the week of January 14th. Claims rose that week from 1.624 million to 1.675 million. That was the third increase in a row, but all things considered, it was only a minor increase as the level of claims remains well below the range of the past several decades and is even below levels from the second half of December. Click here to view Bespoke’s premium membership options.

B.I.G. Tips: Three Consecutive Days of Reversals
Bespoke’s Morning Lineup – 1/27/22 – The Roller Coaster Continues
See what’s driving market performance around the world in today’s Morning Lineup. Bespoke’s Morning Lineup is the best way to start your trading day. Read it now by starting a two-week trial to Bespoke Premium. CLICK HERE to learn more and start your trial.
“There is no risk-free path for monetary policy.” – Jerome Powell
Futures are pointing to a higher open this morning ahead of a busy morning for economic data and what has already been a busy overnight session for earnings and one that saw some wild moves in futures. With Asia down sharply overnight, S&P 500 futures were down well over 1% in the middle of the night, so thankfully most US investors were asleep to see that! As Europe opened for trading, sentiment started to rebound with markets in that region of the world posting mixed returns. Wherever futures are now, it’s unlikely they will stay right where they are for the remainder of the day. The market is attempting to find a new equilibrium point, and that process will keep markets volatile in the weeks ahead.
As mentioned above, the economic calendar is loaded this morning. Jobless claims were mostly inline, Durable Goods missed expectations, GDP was much stronger than expected while Personal Consumption was weaker. On the inflation front, the GDP Price Index was higher than expected at just under 7% while the Core PCE rose 4.9% which was in line with forecasts. The only two reports left on the calendar for today are Pending Home Sales and KC Fed Manufacturing which will both hit the tape at 10 AM.
Read today’s Morning Lineup for a recap of all the major market news and events from around the world, including the latest US and international COVID trends.
Yesterday’s market action showed broad-based declines across the board as the S&P 500 dropped more than 1.6% from 2 PM through the close and every sector dropped more than 0.65%. Sectors hardest hit in the after-meeting sell-off were some of the sectors you would most expect. The rate-sensitive Real Estate sector was the hardest hit falling 2.27%. Behind Real Estate, growth-oriented sectors like Technology, Consumer Discretionary, and Communication Services all reversed their gains falling more than 2%.
At the other end of the spectrum, defensive sectors like Utilities and Consumer Staples held up the best along with Financials which was the only other sector not to reverse at least 1% lower in the aftermath of Powell’s hawkish comments.
Try as they might to seek a port, if the Fed continues to guide to a more hawkish policy stance than markets anticipate at the time, there will little in the way of places for investors to hide in order to avoid at least some of the waves.

Start a two-week trial to Bespoke Premium to read today’s full Morning Lineup.