Richmond Fed Rebounds Without Other Regions
This morning the Richmond Fed released the fifth and final regional manufacturing report. Consistent with other regional Fed reports released this month, which we discussed through our Five Fed Manufacturing Composite in last night’s Closer and will update with the addition of the Richmond Fed again tonight, manufacturing activity remains in contraction. That being said, the index rose 11 points from a recent low of -16 to -5.
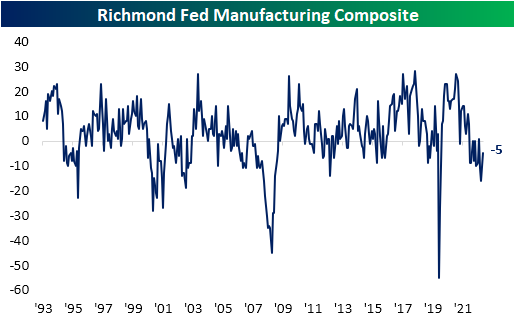
In terms of percentiles, that reading remains in the bottom quartile of its historical range. However, that is a massive improvement from the bottom 5% reading last month. Additionally, the month-over-month increase was significant, just shy of a top decile increase. Breadth in this month’s report was solid with only vendor lead times and employment metrics like wages and availability of skills falling further. Most other categories saw higher month-over-month readings with several (like Shipments and New Orders) being historically large.
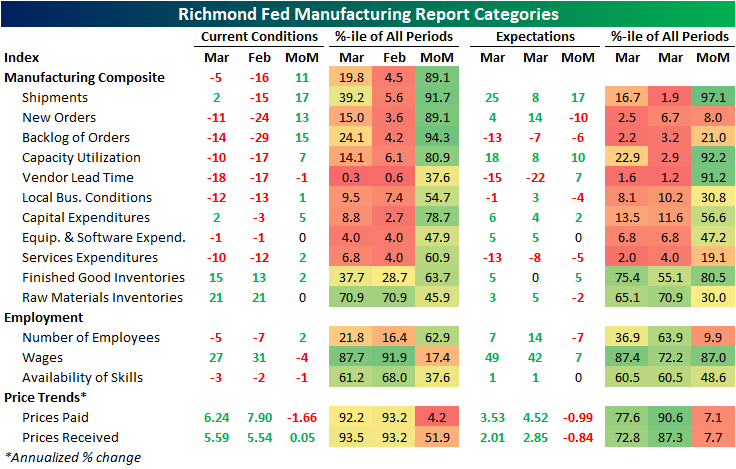
As mentioned above, demand-related metrics like New Orders, Shipments, and Backlogs of Orders surged in March. However, coming from very weak readings in February, it is still not a positive picture. Shipments was the only one of these indices to move back to an expansionary reading. Shipments expectations were also particularly rosy with the reading of 25 marking the highest level in eleven months. Meanwhile, the Vendor Lead Times index remains around some of the lowest levels on record which indicates firms are reporting rapid declines in the time it takes for products to reach their destination.

Given orders are coming in more slowly and supply chain improvements have made doing business easier, inventories are beginning to build. Indices tracking both Raw Material Inventories and Finished Good Inventories have rapidly risen over the past several months following deeply contractionary readings throughout 2020 through 2022. This month, the index for Finished Good Inventories hit a new post-pandemic high while Raw Material Inventories have flattened out after peaking at the end of last year.

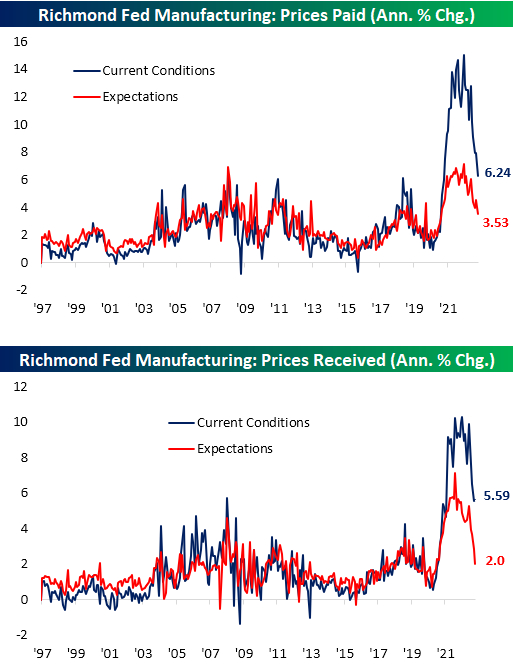
Whereas inventory indices have flown higher, price indices are plummeting. Prices Paid hit a new low of 6.24% with expectations hitting a new low in tow. Prices Received actually saw a very modest increase following sharp declines since November.
Have you tried Bespoke All Access yet?
Bespoke’s All Access research package is quick-hitting, actionable, and easily digestible. Bespoke’s unique data points and analysis help investors better visualize underlying market trends to ultimately make more informed investment decisions.
Our daily research consists of a pre-market note, a post-market note, and our Chart of the Day. These three daily reports are supplemented with additional research pieces covering ETFs and asset allocation trends, global macro analysis, earnings and conference call analysis, market breadth and internals, economic indicator databases, growth and dividend income stock baskets, and unique interactive trading tools.
Click here to sign up for a one-month trial to Bespoke All Access, or you can read even more about Bespoke All Access here.

Bespoke Stock Scores — 3/28/23
Home Prices Fall Nationwide, Except for Miami
Home price figures around the country for January were published by S&P CoreLogic today in the form of the updated Case Shiller indices. Below is a table showing the month-over-month and year-over-year change for the 20 cities tracked along with the three national indices. For each city, we also include how much home prices are still up from their pre-COVID levels in February 2020 and how much home prices are down from their post-COVID peaks.
For the month of January, the national indices showed home prices down about 0.50% month-over-month (m/m) and still up 2-3% on a year-over-year (y/y) basis. There were four cities that saw m/m declines of more than 1%: San Francisco, Seattle, Phoenix, and Las Vegas. Miami was the only city that gained m/m at +0.09%.
Year-over-year, San Francisco is now down 7.60%, while Seattle is down 5.11%. San Diego and Portland are the only other cities in the red y/y, while Tampa and Miami are the only two cities still up 10%+ y/y.


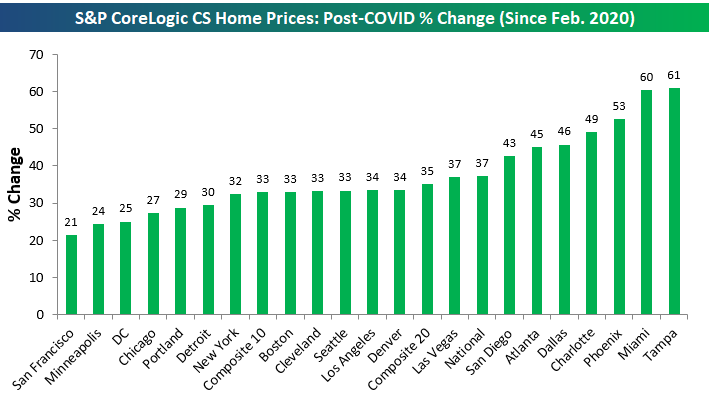
Home prices have been falling hard in recent months (which hasn’t made its way into the official inflation data yet). Below is a look at the drop in home prices from their post-COVID highs. As shown, while some cities like New York, Miami, and Atlanta have yet to fall much at all, cities like San Francisco and Seattle are down more than 15%.

Even with the drops, though, prices are still up across the board from the levels they sat at in February 2020 just before COVID hit. As shown below, the two best-performing cities post-COVID in terms of home price appreciation are two Florida cities: Tampa and Miami. Cities that are up the least post-COVID (but still up 20-30%) include Portland, Chicago, DC, Minneapolis, and San Francisco.
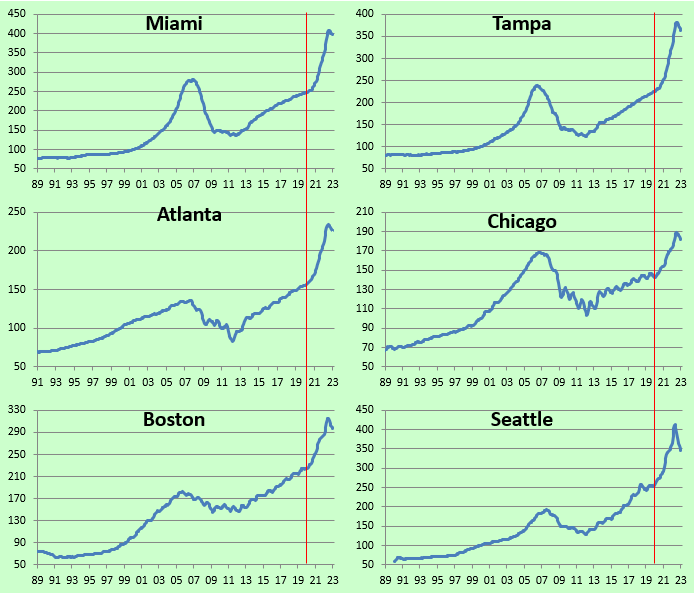
Below is a look at the actual levels of the 20 Case Shiller city indices plus the three national indices. We’ve drawn lines to show when COVID hit so you can see how much prices are up from pre-COVID levels.


Have you tried Bespoke All Access yet?
Bespoke’s All Access research package is quick-hitting, actionable, and easily digestible. Bespoke’s unique data points and analysis help investors better visualize underlying market trends to ultimately make more informed investment decisions.
Our daily research consists of a pre-market note, a post-market note, and our Chart of the Day. These three daily reports are supplemented with additional research pieces covering ETFs and asset allocation trends, global macro analysis, earnings and conference call analysis, market breadth and internals, economic indicator databases, growth and dividend income stock baskets, and unique interactive trading tools.
Click here to sign up for a one-month trial to Bespoke All Access, or you can read even more about Bespoke All Access here.
Chart of the Day – Consumers Still Want Nothing to Do With Stocks
Bespoke’s Morning Lineup – 3/28/23 – Melatonin Market
See what’s driving market performance around the world in today’s Morning Lineup. Bespoke’s Morning Lineup is the best way to start your trading day. Read it now by starting a two-week trial to Bespoke Premium. CLICK HERE to learn more and start your trial.
“If you want total security, go to prison. There you’re fed, clothed, given medical care, and so on. The only thing lacking… is freedom.” – Dwight D Eisenhower

Below is a snippet of content from today’s Morning Lineup for Bespoke Premium members. Start a two-week trial to Bespoke Premium now to access the full report.
You couldn’t really ask for a more sleepy morning in the markets as futures are basically unchanged. S&P 500 futures are up less than a point, the Nasdaq is indicated to open down less than two points, and the Dow is indicated to open up by less than a point as well. Treasury yields are higher with the 10-year yield up by 4 basis points (bps) to 3.57% while the 2-year yield is up by 7 bps and back over 4%.
We could see the market wake up later on today with Wholesale Inventories at 8:30, the FHFA House Price Index at 9:00, and then finally at 10, we’ll get Consumer Confidence and Richmond Fed. The Richmond Fed report will be the fifth and final of the five Fed manufacturing reports that are reported each month, and like the rest of them (which showed no growth), it is expected to come in negative, although not as bad as February’s reading.
Investors can’t seem to make up their minds as to where stocks should go from here, how the bank crisis will play out, and whether the FOMC’s next move will be a rate hike, a rate pause, or a rate cut! Think about it. How often is it that credible arguments can be made for any of those three decisions? With that uncertainty, is it any surprise that the S&P 500 is sandwiched right between its 50 and 200-day moving averages (DMA)?

Even as the S&P 500 shows the characteristics of an indecisive market, there’s more dispersion at the sector level. Of the eleven sectors, seven (shown below) closed yesterday below both their 50 and 200-DMAs.


On the upside, the only two sectors above both their 50 and 200-DMAs are Communication Services and Technology (below). That leaves just one sector – Industrials (XLI) – which, like the S&P 500, is sandwiched between those two averages.

Our Morning Lineup keeps readers on top of earnings data, economic news, global headlines, and market internals. We’re biased (of course!), but we think it’s the best and most helpful pre-market report in existence!
Start a two-week trial to Bespoke Premium to read today’s full Morning Lineup.
Daily Sector Snapshot — 3/27/23
Chart of the Day – Treasury Yields Break Streaks Above Their 200-DMA
Short Interest Update
Although equities broadly are starting the new week higher, the most heavily shorted stocks are trading lower today. In the chart below, we show the relative strength of an index of the 100 most heavily shorted stocks versus the Russell 3,000 since January 2021 (the peak of the meme stock mania). Overall, the past couple of years since that period have consistently seen heavily shorted names underperform as seen through the downward trending line below. Although heavily shorted names saw some outperformance in January, they are making new lows.

On Friday, the latest short interest data as of mid-March was released by FINRA. Overall, there has not been too much of a change in short interest levels with the average reading on short interest as a percentage of float of Russell 3,000 stocks rising by 5 bps since the start of the year to 5.8%.
Prior to the changes to industry classifications that went into effect one week ago, the formerly labeled “retailing” industry consistently held the highest levels of short interest. Now, it is the Consumer Discretionary Distribution and Retail industry in the top spot with an average short interest level of 12.7%. That is up from 12.5% coming into the year and is multiple percentage points higher than the two next highest industries: Pharmaceuticals, Biotechnology & Life Sciences (9.36%) and Autos (9.18%). In spite of the recent bank closures, the banking industry actually has the lowest average levels of short interest. That being said, the latest data as of March 15th would have only accounted for a few days following the collapse of SVB. As such, the next release scheduled for April 12th with end-of-month data will provide a better read on the recent banking trouble’s impact on short interest levels.

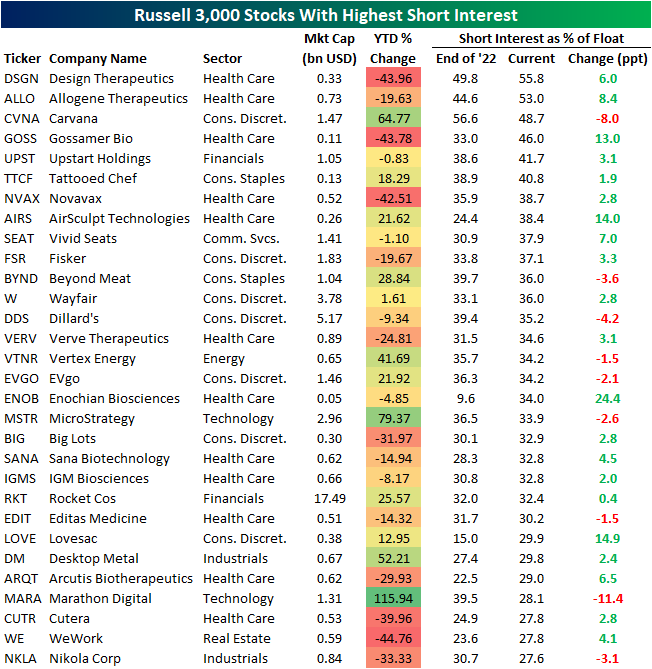
In the table below, we show the individual Russell 3,000 stocks with the highest levels of short interest as of the March 15th data. The sole two stocks with more than half of shares sold short are both Health Care names: Design Therapeutics (DSGN) and Allogene Therapeutics (ALLO). Both have seen short interest levels rise mid-single digits year to date. Other notables with high levels of short interest include some names that were briefly in vogue in recent years like Carvana (CVNA) and Beyond Meat (BYND). While short interest levels remain elevated, those are also two of the stocks listed below that have seen the largest declines in short interest this year which is likely due to solid appreciation in their stock prices. Only Marathon Digital (MARA) has seen a larger drop with its short interest level falling 11.4 percentage points since the end of last year after the stock more than doubled year to date. We would also note another crypto-related name, MicroStrategy (MSTR), is on the list and has been the second-best performer of the Russell 3,000 stocks with the highest short interest.
Have you tried Bespoke All Access yet?
Bespoke’s All Access research package is quick-hitting, actionable, and easily digestible. Bespoke’s unique data points and analysis help investors better visualize underlying market trends to ultimately make more informed investment decisions.
Our daily research consists of a pre-market note, a post-market note, and our Chart of the Day. These three daily reports are supplemented with additional research pieces covering ETFs and asset allocation trends, global macro analysis, earnings and conference call analysis, market breadth and internals, economic indicator databases, growth and dividend income stock baskets, and unique interactive trading tools.
Click here to sign up for a one-month trial to Bespoke All Access, or you can read even more about Bespoke All Access here.
Commercial Bank Deposits Down a Record 3.33% YoY
The Federal Reserve’s FRED data on commercial bank deposits was just updated through the week of 3/15. From the prior week, deposits fell roughly $100 billion, or about 0.56% from $17.6 trillion down to $17.5 trillion. A week-over-week decline of 0.56% is nothing out of the norm, although it was the biggest decline in percentage terms since last April when deposits fell 0.6% during the week of 4/20.
What is out of the norm is the drop we’ve seen in bank deposits over the last year. Prior to 2023, the largest year-over-year decline we’d ever seen in bank deposits was a 1.58% drop back in September 1994. That record drop was broken earlier this year when we got a reading of -1.61% during the week of 2/1. Since 2/1, the year-over-year decline has only gotten worse. As of the most recent week (3/15), the year-over-year decline stands at -3.33%.
Below is a chart showing the year-over-year change in commercial bank deposits using data from FRED. What stands out the most is not just that we’re now at record YoY lows, but that it’s coming after what had been record YoY increases in deposits. Remember, after COVID hit, the government deposited cash into the bank accounts of Americans multiple times.

Below is a look at the absolute level of commercial bank deposits over the years going back to 1974 when FRED’s data begins. During the COVID recession from March through May 2020, bank deposits increased roughly $2 trillion. As you can see in the chart, we’ve never seen a spike anywhere near as large over such a short period of time. Notably, though, deposits kept on running higher for the next two years, rising another $2.8 trillion by the time they peaked at $18.16 trillion in mid-April 2022. That peak came a month after the Fed’s first rate hike of the current tightening cycle, and since then we’ve seen deposits fall about $650 billion from their highs. Given how elevated deposits remain above pre-COVID levels, there’s no reason to think they won’t fall further unless banks really step up the interest they’re paying on deposits given a Fed Funds rate of 5%.

Have you tried Bespoke All Access yet?
Bespoke’s All Access research package is quick-hitting, actionable, and easily digestible. Bespoke’s unique data points and analysis help investors better visualize underlying market trends to ultimately make more informed investment decisions.
Our daily research consists of a pre-market note, a post-market note, and our Chart of the Day. These three daily reports are supplemented with additional research pieces covering ETFs and asset allocation trends, global macro analysis, earnings and conference call analysis, market breadth and internals, economic indicator databases, growth and dividend income stock baskets, and unique interactive trading tools.
Click here to sign up for a one-month trial to Bespoke All Access, or you can read even more about Bespoke All Access here.
Bespoke’s Morning Lineup – 3/27/23 – No News is Good News
See what’s driving market performance around the world in today’s Morning Lineup. Bespoke’s Morning Lineup is the best way to start your trading day. Read it now by starting a two-week trial to Bespoke Premium. CLICK HERE to learn more and start your trial.
“Sitting here in limbo, waiting for the dice to roll.”– Jimmy Cliff
Below is a snippet of content from today’s Morning Lineup for Bespoke Premium members. Start a two-week trial to Bespoke Premium now to access the full report.
Andrew Jackson once said that he had always been afraid of banks, and the market echoed that sentiment for the last several weeks, but this morning, they’ve put those fears aside. A deal from First Citizens Bank to acquire the assets of SVB Financial coupled with the fact that there were no other major headlines of trouble over the weekend here or in Europe, specifically with Deutsche Bank, has futures firmly in positive territory to start the last trading week of the first quarter. The economic calendar is quiet today with the Dallas Fed Manufacturing survey being the only report scheduled for release (10:30 Eastern). In Europe, the major equity indices are all up by more than 1%. It’s a good start at least!
For the equity market, we’re kicking off the last week of the quarter in a bit of a limbo period as the S&P 500 closed out last week modestly above its 200-day moving average (DMA) after briefly breaking below it during the trading day Friday. That was a moral victory for bulls, but it came just a day after it failed to close above its 50-DMA on Thursday after briefly breaking through it to the upside.
Given the pre-opening strength in equities and lack of new stresses in the financial sector, treasuries are selling off this morning, especially at the short end of the curve as the two-year yield is up close to 20 basis points (bps) and inching towards 4%. Crude oil is back above $70 per barrel, and gold is down 1.5% after failing to hold the $2,000 level last week.

Within the S&P 500, it was a broad rally last week as nine of eleven sectors (even Financials!) finished the week in positive territory. The only losers were Real Estate and Utilities which were both down close to 2%. On the upside, it was an interesting mix as Communication Services and Technology led the way higher (so surprise), but right behind those two sectors, Materials and Energy both also rallied over 1%.

Our Morning Lineup keeps readers on top of earnings data, economic news, global headlines, and market internals. We’re biased (of course!), but we think it’s the best and most helpful pre-market report in existence!
Start a two-week trial to Bespoke Premium to read today’s full Morning Lineup.