Chart of the Day – All on Tech
Bespoke’s Morning Lineup – 1/7/26 – Memories
See what’s driving market performance around the world in today’s Morning Lineup. Bespoke’s Morning Lineup is the best way to start your trading day. Read it now by starting a two-week trial to Bespoke Premium. CLICK HERE to learn more and start your trial.
“Without memory, there is no culture. Without memory, there would be no civilization, no society, no future.” – Elie Wiesel

Below is a snippet of commentary from today’s Morning Lineup. Start a two-week trial to Bespoke Premium to view the full report.
It’s another flat morning for US equity futures, as S&P 500 futures are flat while the Nasdaq is indicated to open down 0.20%. Treasury yields are down over 5 bps, taking the 10-year yield down to 4.12% as the monthly ADP Employment report came in roughly in line with expectations. Crude oil is lower and trading down to $57 per barrel as the US just announced that Venezuelan sanctions will be rolled back to enable the sale of additional oil. In the precious metals space, gold is down 1%, while silver, copper, and platinum look at much steeper losses as volatility in that space continues.
Asian stocks took a more mixed path overnight, with the Nikkei and Hang Seng both falling close to 1%, while the Shanghai Composite had a marginal gain. South Korea led the way to the upside once again, rallying 0.6%. The index has now closed at record highs every day this year as memory stocks like Samsung Electronics and SK Hynix have surged 17.6% and 14.0% YTD, respectively. It also comes just a day ahead of earnings from Samsung Electronics tomorrow.
European stocks are mixed. While the STOXX 600 is up 0.1%, the only major country benchmark trading higher is Germany (+0.6%). CPI for the Eurozone came in at 2.0% y/y, which was right in line with forecasts and down modestly from November’s reading of 2.1%.
For years, memory was an afterthought in the technology investment space and considered nothing more than a commodity. Based on the last year, though, Elie Wiesel may have been right all along in terms of its importance as stocks tied to the sector have gone berserk. Yesterday, we noted that despite the last numbers on the calendar changing a week ago, not much else has changed in terms of stock price performance this year. The two top-performing stocks in the S&P 500 last year were Western Digital (WDC) and Micron (MU), which both rallied over 200%. Three days into the new year, both stocks are up over 20%! Sandisk (SNDK), which didn’t even trade for a full year in 2025, was up 560% from its IPO in February through year end. This year, it’s already up 47% – in three trading days, one of which was a down day!
Of the main memory stocks, WDC has the longest history, so we wanted to highlight some charts showing how extreme the moves have been.
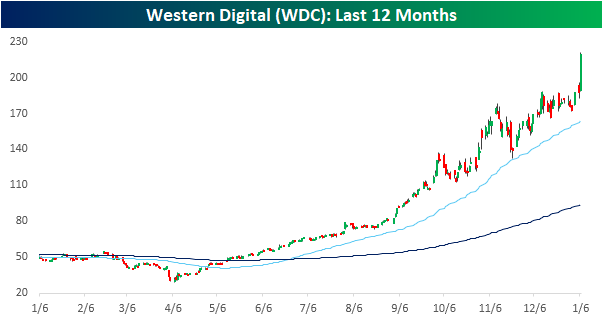
First, simply looking at a one-year chart, the stock was under $65 per share a year ago, but after falling more than 40% from its February high through its April low, the stock hasn’t looked back. Even the biggest winners have their fair share of volatility.
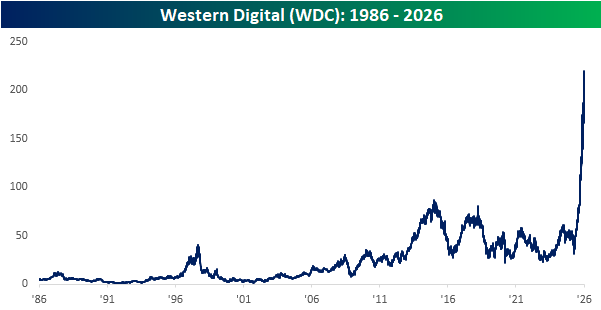
From a longer-term perspective, the price chart looks like a hockey stick, or the inverse of the US turkey population on a YTD basis through Thanksgiving. From 1986 through earlier last year, the stock never traded about $100 per share (on a split-adjusted basis), but yesterday it closed above $200.
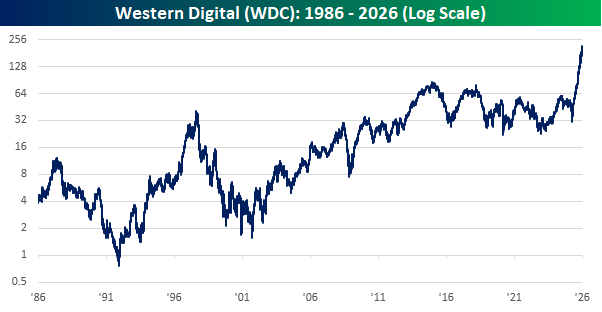
Looking at the stock’s price history using a log scale where each gridline represents a doubling of the stock price, the chart looks more reasonable, but the slope of the move in the last year is still unprecedented.
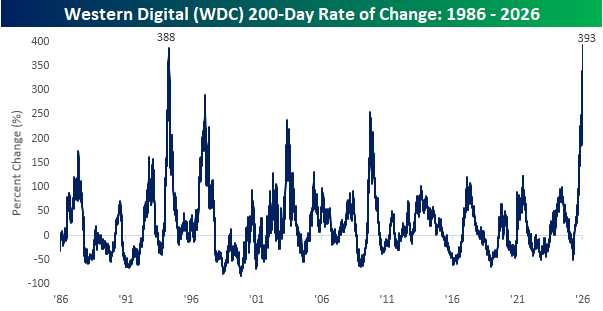
The next chart is perhaps the most incredible regarding WDC’s recent rally. Through yesterday’s close, WDC’s share price rallied 393%, which was up from a 200-day move of 318% the day before. With that move, the stock’s rally over the last 200-days is larger than any other 200-day rally since at least 1986. That’s over 40 years!
The Closer – Parabolic Metals, PMIs, Investor Sentiment – 1/6/26
Log-in here if you’re a member with access to the Closer.
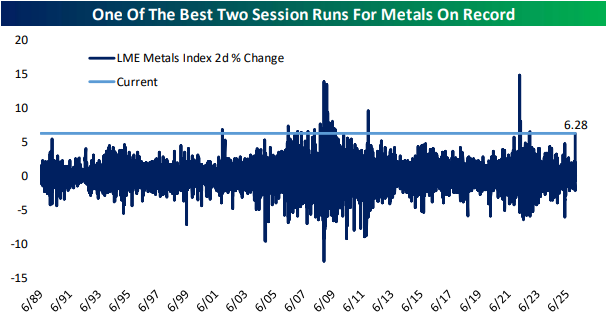
Looking for deeper insight into markets? In tonight’s Closer sent to Bespoke Institutional clients, we lead off with a dive into the parabolic moves in metal prices (pages 1 and 2). We also give some commentary on the latest Congressional news followed by a look into auto sales data (page 3). After a look at the latest Logistics Managers Index (page 4), we close out with a review of some of the latest investor sentiment gauges (page 5).
See today’s full post-market Closer and everything else Bespoke publishes by starting a 14-day trial to Bespoke Institutional today!
Daily Sector Snapshot — 1/6/26
Bespoke’s Consumer Pulse Report — January 2026
Bespoke’s Consumer Pulse Report is an analysis of a huge consumer survey that we run each month. Our goal with this survey is to track trends across the economic and financial landscape in the US. Using the results from our proprietary monthly survey, we dissect and analyze all of the data and publish the Consumer Pulse Report, which we sell access to on a subscription basis. Sign up for a 30-day free trial to our Bespoke Consumer Pulse subscription service. With a trial, you’ll get coverage of consumer electronics, social media, streaming media, retail, autos, and much more. The report also has numerous proprietary US economic data points that are extremely timely and useful for investors.
We’ve just released our most recent monthly report to Pulse subscribers, and it’s definitely worth the read if you’re curious about the health of the consumer in the current market environment. Start a 30-day free trial for a full breakdown of all of our proprietary Pulse economic indicators.

US Market Cap Loses Ground
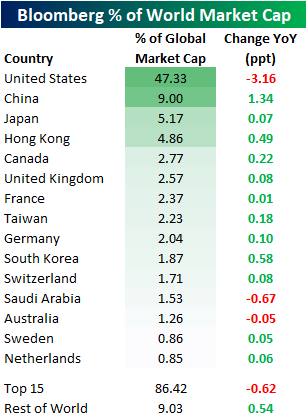
The United States continues to hold a dominant share of global stock market capitalization. In fact, it currently accounts for 47.3% of global market cap which is a multiple higher than the next largest countries: China at 9% and Japan at 5.2%. While the US still holds a lion’s share of market cap, that share did take a hit over the past year as international markets generally outperformed. As shown below, the US dropped 3.16 percentage points in the past year. The country to pick up the greatest share of those losses was China, whose share rose 1.34 percentage points. The next largest increase was South Korea as that country’s form of mega-cap stocks like SK Hynix and Samsung have soared alongside other international memory chip makers. Hong Kong also gained close to half of a percentage point of weight while other gainers saw much more modest moves.
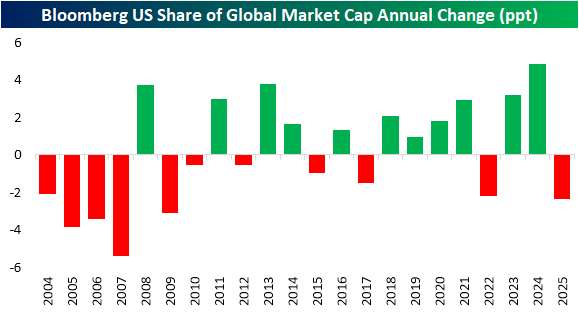
In the chart below, we show the changes in the United States’ share of global market cap annually going back to 2004. As shown, the drop in 2025 modestly surpassed the drop seen in 2022 when the major indices spent the year in the midst of bear markets. Prior to that, the last times the US lost such a large share of global market cap were the Financial Crisis years and the mid-2000s when there was a trend of international stock market outperformance.
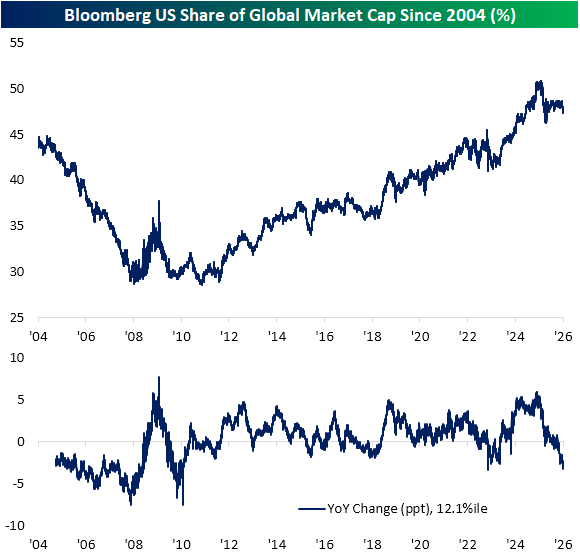
Showing another way with some greater detail, in the charts below we show the United States’ share of global market cap and rolling year-over-year change since 2004. While the US lost weight last year, it entered 2025 and spent a sizable portion of Q1 possessing more than 50% of global market cap. The Tariff fueled sell off in the early spring sent that share sharply lower, bottoming in the mid-40% range, although those losses subsided and remained largely stable throughout most of the rest of the year. That is until December when its share of global market cap began to roll over once again. Currently, the YoY change in weight of -3.2 percentage points ranks in the 12th percentile and is the largest drop since the tail end of the 2022 bear market and 2010 before that.
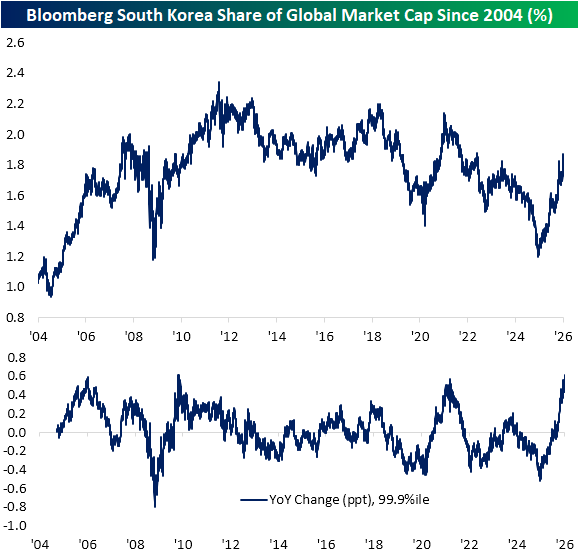
As noted earlier, one notable country that has picked up the US’s lost share of market cap has been South Korea. While it is still a minor weight in the grand scheme of things, not even cracking 2%, it has hit multi-year highs. More impressively, the over 0.6 percentage point jump in the past year ranks in the 99th percentile of moves. The spring of 2021, fall of 2009, and January 2006 are the other most recent examples of South Korea gaining such a large share of international market cap.
Finally, we would note that although multiple European countries were among the top performers in 2025, the region’s share of market cap didn’t grow by much. As shown below, Eurozone countries’ collective share of global market cap is currently hovering around 8%, which is in the middle of the past few years’ range and at the low end of the range for the past 20 years.
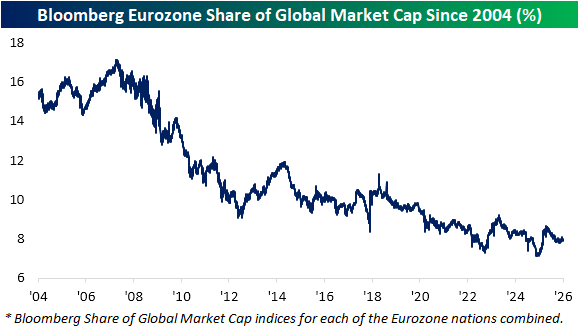

Chart of the Day – Energy Rocks
Bespoke’s Morning Lineup – 1/6/26 – Only the Year Has Changed
See what’s driving market performance around the world in today’s Morning Lineup. Bespoke’s Morning Lineup is the best way to start your trading day. Read it now by starting a two-week trial to Bespoke Premium. CLICK HERE to learn more and start your trial.
“The freshest moments in my films have always been with unknown actors.” – John Singleton
Below is a snippet of commentary from today’s Morning Lineup. Start a two-week trial to Bespoke Premium to view the full report.
The rally in the US to kick off the week yesterday continued overnight in Asia as Japan, China, and South Korea all rallied between 1.0% and 1.5%. The strength came amid a weaker manufacturing PMI reading in Hong Kong and a weaker services PMI in India. In China, the PBoC said that monetary policy would be maintained at loose levels to further support growth.
European stocks are also positive, but with more modest gains. The STOXX 600 is up 0.2%, and France’s 0.1% decline is the only major country benchmark in the red as bank stocks lag. The December Services PMI for December came in slightly weaker than expected, decelerating to 52.4 from 53.6 in November.
In the US, futures are on either side of the flatline, with S&P 500 futures barely higher, while Dow futures are barely lower. Nasdaq futures are faring better, but with an implied gain of 0.22% aren’t shooting the lights out. Treasury yields, crude oil, and gold are all fractionally higher, while silver, platinum, and palladium are all up over 1%. After a solid rally yesterday, which took it to its best levels in six weeks, Bitcoin is down modestly at just under $94K.
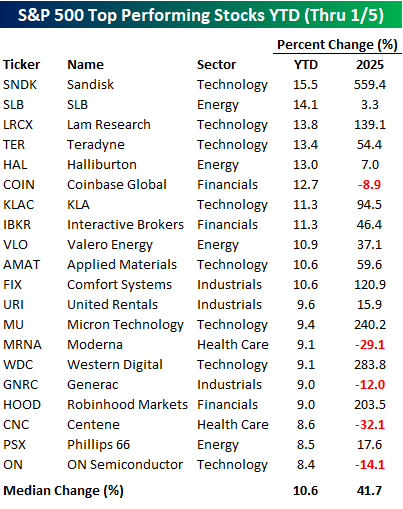
The market is always changing, but just because the year on the calendar changed last week, the performance of stocks leading the way higher hasn’t changed all that much- at least not yet. The table below lists the 20 best-performing S&P 500 stocks so far this year. For starters, Sandisk (SNDK) is the best-performing stock this year, and it was also the best in the S&P 500 last year, even though it didn’t have a full year of trading to gain more than 500%!
Besides SNDK, five of the other top performers were also stocks that more than doubled in 2025! Sure, there were some losers last year, like Centene (CNC) and Moderna (MRNA), that have gotten off to a strong start this year, but overall, last year’s median performance of the 20 best-performing S&P 500 stocks so far this year was a gain of 41.7%. The list is also dominated by tech, with eight of the 20 stocks coming from that sector.
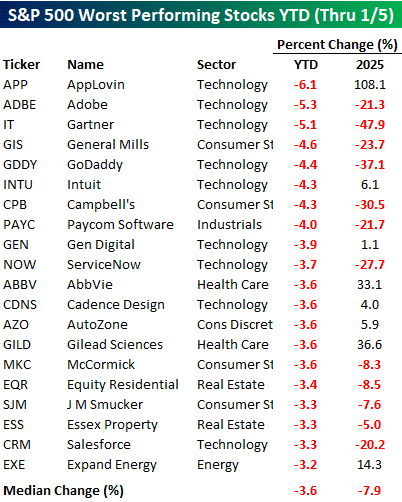
While eight of the 20 best-performing stocks in the S&P 500 so far this year are from the Technology sector, nine of the worst performers are also from the S&P 500’s largest sector. Besides AppLovin (APP), though, none of them were big winners in 2025. Of the 20 worst performers in the first two trading days of 2026, twelve were also down in 2025, and the median decline of all 20 was 7.9%. It’s also worth pointing out that the magnitude of the declines in the biggest losers so far this year is basically a third of the magnitude of the size of the gain in the biggest winners (-3.6% vs 10.6%).
Another area where the change in the calendar didn’t impact that market was in the volatility of various metals. Silver is a perfect example, as volatility in gold’s bridesmaid hasn’t skipped a beat in the first two trading days of 2026. While silver only moved 0.58% last Friday, yesterday’s 7.1% rally was right in line with what has become the norm in recent weeks, and the chart is beginning to look increasingly funky with multiple detached candles with no overlap to the prior day’s range.
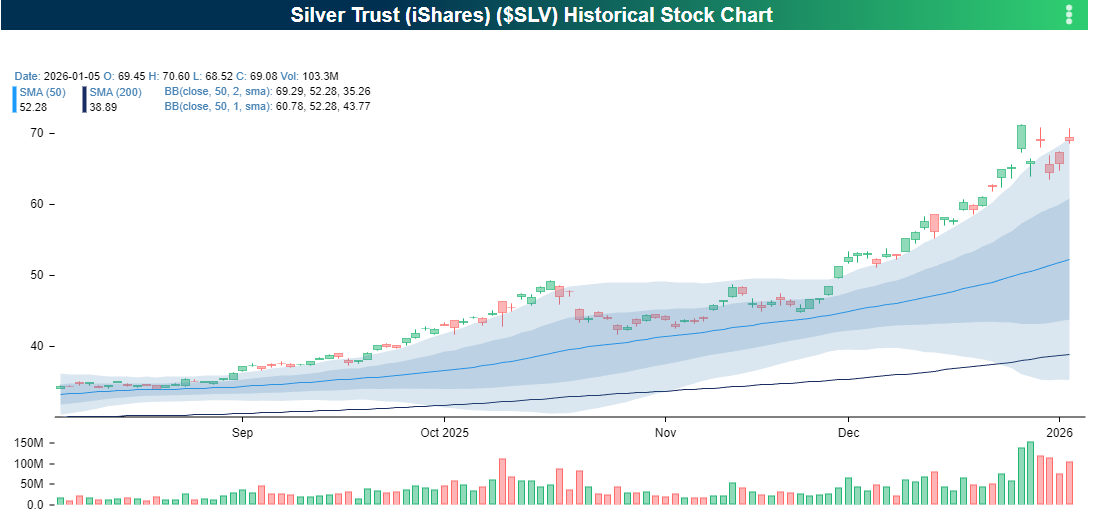
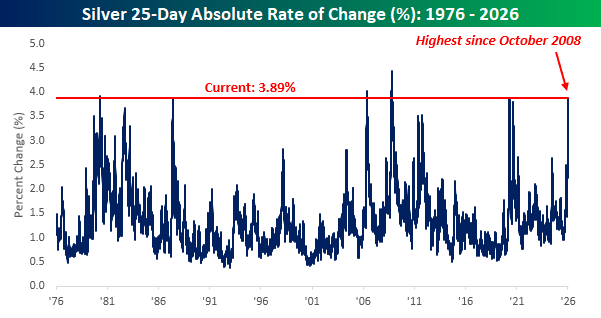
Over the last six trading days, silver’s daily move has been above 7% on five separate trading days, and the average daily move during the last 25 trading days has been 3.89%. That’s the highest average daily move over five weeks since October 2008, and there have only been a handful of periods in the last 50 years where the average daily move was higher. It doesn’t get more volatile than that. Somebody better put a ring on it.
The Closer – Venezuela Fallout, FX, Energy Surge – 1/5/26
Log-in here if you’re a member with access to the Closer.
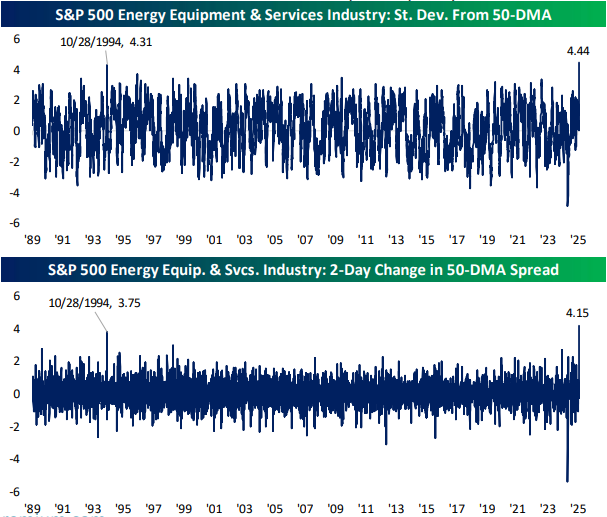
Looking for deeper insight into markets? In tonight’s Closer sent to Bespoke Institutional clients, we begin with a review of the latest ISM data (page 1) followed by a checkup on crude term structure following the happenings in Venezuela this weekend (page 2). We also checkup on emerging market FX (page 3) and the surge in Energy sector stocks (page 4). We finish out with an updated look at the Commitments of Traders report (pages 5 and 6).
See today’s full post-market Closer and everything else Bespoke publishes by starting a 14-day trial to Bespoke Institutional today!