The Bespoke Report – 11/18/22 – Trends Intact
This week’s Bespoke Report newsletter is now available for members.
US equity markets pulled back and made a lower high despite cooing doves this week from the Federal Reserve and a plunging dollar. US yield curves inverted further as markets tempered their optimism on China. Earnings season has finally wound up with better-than-expected results, despite a sudden slowdown in guidance which has flipped decisively negative after two years of remarkable optimism from corporate America. Economic data this week was high volume and covered housing, consumer spending, manufacturing, and more. We discuss in detail as well as taking a look at what tech layoffs say about the broader labor market, how consumer discretionary stocks have traded into Thanksgiving, the signals being sent by the US yield curve and fixed income markets more broadly, and runoff in liquidity as the Fed removes reserves from the system as well as raising rates. We cover all that and much more in this week’s Bespoke Report.
To read this week’s full Bespoke Report newsletter and access everything else Bespoke’s research platform has to offer, start a two-week trial to one of our three membership levels.
Q3 Earnings Season Conference Call Recaps
Bespoke’s Conference Call Recaps provide helpful summaries of corporate conference calls throughout earnings season. We go through the conference calls of some of the most important companies in the market and summarize key topics covered by management. These recaps include information regarding each company’s financial results, growth by segment, as well as some aspects of the business that management expects to impact future results. We also identify trends emerging for the broader economy in these recaps.
Bespoke’s Conference Call Recaps are available at the Bespoke Institutional level only. You can sign up for Bespoke Institutional now and receive a 14-day trial to read our newest Conference Call recaps. To sign up, choose either the monthly or annual checkout link below:
Bespoke Institutional – Monthly Payment Plan
Bespoke Institutional – Annual Payment Plan
Below is a list of the Conference Call Recaps published during the Q3 2022 and Q2 2022 earnings reporting period.
Q3 2022 Recaps:
Recaps published during Q2 2022 are available with a Bespoke Institutional subscription:
Deere Q3 Conference Call — 8/19/22
Cisco Q4 Conference Call — 8/18/22
Target Q2 Conference Call — 8/17/22
Home Depot Q2 Conference Call — 8/16/22
Walmart Q2 Conference Call — 8/16/22
Disney Q3 Conference Call — 8/10/22
The Trade Desk Q2 Conference Call — 8/10/22
Coinbase Q2 Conference Call — 8/9/22
Tyson Foods Q3 Conference Call — 8/8/22
Alibaba Q1 Conference Call — 8/4/22
PayPal Q2 Conference Call — 8/4/22
Starbucks Q3 Conference Call — 8/4/22
Advanced Micro Devices Q2 Conference Call — 8/4/22
Caterpillar Q2 Conference Call — 8/2/22
Uber Q2 Conference Call — 8/2/22
Builders FirstSource Q2 Conference Call — 8/1/22
Apple Q3 Conference Call — 7/28/22
Amazon Q2 Conference Call — 7/28/22
Ford Q2 Conference Call — 7/27/22
Meta Platforms Q2 Conference Call — 7/27/22
Automatic Data Processing Q4 Conference Call — 7/27/22
Alphabet Q2 Conference Call — 7/26/22
Microsoft Q4 Conference Call — 7/26/22
3M Q2 Conference Call — 7/26/22
McDonald’s Q2 Conference Call — 7/26/22
Whirlpool Q2 Conference Call — 7/25/22
PPG Industries Q2 Conference Call — 7/22/22
American Express Q2 Conference Call — 7/22/22
Freeport-McMoRan Q2 Conference Call — 7/21/22
Blackstone Q2 Conference Call — 7/21/22
Tesla Q2 Conference Call — 7/20/22
Baker Hughes Q2 Conference Call — 7/20/22
Netflix Q2 Conference Call — 7/19/22
Johnson & Johnson Q2 Conference Call — 7/19/22
International Business Machines Q2 Conference Call — 7/18/22
Goldman Sachs Q2 Conference Call — 7/18/22
Citigroup Q2 Conference Call — 7/15/22
Blackrock Q2 Conference Call — 7/15/22
JP Morgan Q2 Conference Call — 7/14/22
Taiwan Semiconductor Q2 Conference Call — 7/14/22
Delta Q2 Conference Call — 7/13/22
PepsiCo Q2 Conference Call — 7/12/22
Constellation Brands Q1 Conference Call — 6/30/22
Walgreens Q3 Conference Call — 6/30/22
Nike Q4 Conference Call — 6/27/22
CarMax Q1 Conference Call — 6/24/22
FedEx Q4 Conference Call — 6/23/22
KB Home Q2 Conference Call — 6/22/22
Adobe Q2 Conference Call — 6/16/22
Kroger Q1 Conference Call — 6/16/22
Oracle Q4 Conference Call — 6/13/22
Lululemon Q1 Conference Call — 6/2/22
Chinese Stocks Up But Still Out
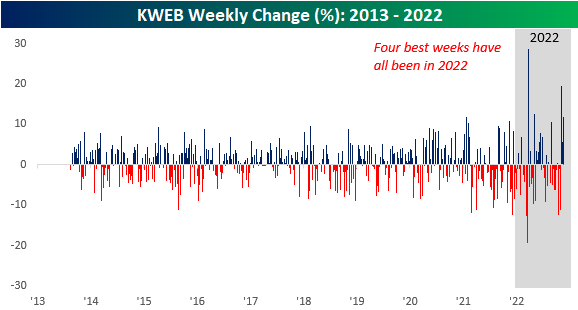
It has been quite the week for Chinese stocks as stimulus and optimism over the easing of COVID restrictions has investors and traders buying up stocks leveraged to China. The Kraneshares China Internet ETF (KWEB) was up over 11% heading into today which was the best week for the ETF…in two weeks! If the gains for KWEB heading into today hold up through the end of the session, the four best weeks in KWEB’s history dating back to 2013 will have all occurred this year!
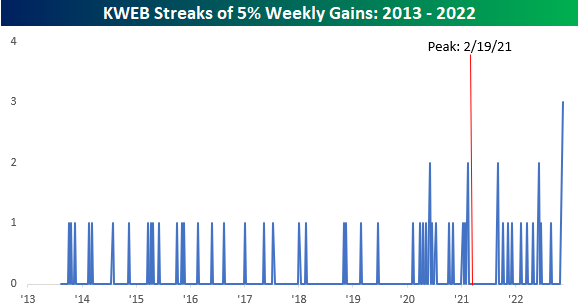
In addition to having two separate weekly gains of over 10% in November, KWEB is also on pace for its third straight weekly gain of 5% or more. In the ETF’s nearly 10-year history, there has never been another streak of three weeks where the ETF has rallied 5% or more. It’s also interesting to note that three of the ETF’s five streaks of two or more weeks in a row have all come since the ETF peaked in February 2021.
An old maxim of markets is that big upside moves usually happen in bear markets, and the action in KWEB this year is a textbook example. Despite the ETF having its four best weeks on record this year, and two separate streaks where the ETF was up 5% or more in at least two consecutive weeks, KWEB is still down over 25% YTD and is more than 70% from its high less than two years ago. Click here to learn more about Bespoke’s premium stock market research service.
Bespoke’s Morning Lineup – 11/18/22 – Waiting for the Fat Pitch
See what’s driving market performance around the world in today’s Morning Lineup. Bespoke’s Morning Lineup is the best way to start your trading day. Read it now by starting a two-week trial to Bespoke Premium. CLICK HERE to learn more and start your trial.
“I became a good pitcher when I stopped trying to make them miss the ball and started trying to make them hit it.” – Sandy Koufax
Below is a snippet of content from today’s Morning Lineup for Bespoke Premium members. Start a two-week trial to Bespoke Premium now to access the full report.
We made it! We’re not sure about you, but following rumors that Twitter was going to break overnight, we slept soundly. But that’s just us. We’re sure that there are more than a few people out there who as much as they say they hate it, couldn’t imagine a life without their beloved little blue bird. OK. Maybe we sometimes find ourselves in that camp too. Depending on where you stand on social media or these days, your opinion of Elon Musk, fortunately or unfortunately, Twitter is still chipping this morning.
Twitter’s survival is just as good a reason as any to attribute as the catalyst for this morning’s rally in futures, but lower oil prices aren’t hurting matters. We did find it interesting, though, that just as yesterday, futures were positive heading into the European open and steadily lost steam, today has been an exact mirror image. For the rest of the day, the only economic reports on the calendar are Existing Home Sales and Leading Indicators at 10 AM.
It’s been a relatively strange week in terms of index and sector performance as returns have been all over the place. At the index level, all the major index ETFs are above their 50-DMAs, but the S&P 500 (SPY) and Dow (DIA) are both overbought while the Nasdaq 100 (QQQ) and Russell 2000 (IWM) are in neutral territory. The Russell is pulling back from more overbought levels last week with a decline of more than 1.5%, but the Nasdaq 100 gained ground as it’s the only one of the four index ETFs that is up in the five-day period ending yesterday.

While the Nasdaq 100 has been the top-performing index ETF, Technology (XLK) isn’t the top-performing sector. With a gain of 0.79% over the last week, it is underperforming both Communication Services (XLC) and Energy (XLE) by more than a full percentage point. On the downside, five sectors are down a full percentage point in the last five trading days with Real Estate (XLRE) and Utilities (XLU) leading the way lower with declines of more than 2%. The only two sectors below their 50-DMAs are Consumer Discretionary (XLY) and Utilities (XLU) while Energy, Industrials (XLI), and Materials (XLB) are the most extended relative to their 50-DMAs at 8.75% or more above that level. Communications Services and Utilities, meanwhile, are right in the zone and both within 1% of their 50-DMAs.

Our Morning Lineup keeps readers on top of earnings data, economic news, global headlines, and market internals. We’re biased (of course!), but we think it’s the best and most helpful pre-market report in existence!
Start a two-week trial to Bespoke Premium to read today’s full Morning Lineup.
The Bespoke 50 Growth Stocks — 11/17/22
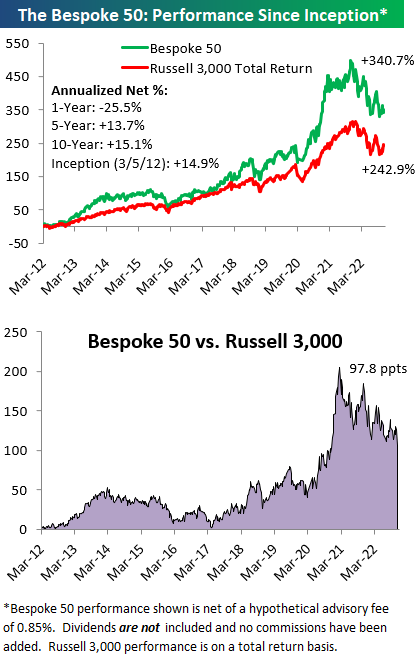
The “Bespoke 50” is a basket of noteworthy growth stocks in the Russell 3,000. To make the list, a stock must have strong earnings growth prospects along with an attractive price chart based on Bespoke’s analysis. The Bespoke 50 is updated weekly on Thursday unless otherwise noted. There were no changes to the list this week.
The Bespoke 50 is available with a Bespoke Premium subscription or a Bespoke Institutional subscription. You can learn more about our subscription offerings at our Membership Options page, or simply start a two-week trial at our sign-up page.
The Bespoke 50 performance chart shown does not represent actual investment results. The Bespoke 50 is updated weekly on Thursday. Performance is based on equally weighting each of the 50 stocks (2% each) and is calculated using each stock’s opening price as of Friday morning each week. Entry prices and exit prices used for stocks that are added or removed from the Bespoke 50 are based on Friday’s opening price. Any potential commissions, brokerage fees, or dividends are not included in the Bespoke 50 performance calculation, but the performance shown is net of a hypothetical annual advisory fee of 0.85%. Performance tracking for the Bespoke 50 and the Russell 3,000 total return index begins on March 5th, 2012 when the Bespoke 50 was first published. Past performance is not a guarantee of future results. The Bespoke 50 is meant to be an idea generator for investors and not a recommendation to buy or sell any specific securities. It is not personalized advice because it in no way takes into account an investor’s individual needs. As always, investors should conduct their own research when buying or selling individual securities. Click here to read our full disclosure on hypothetical performance tracking. Bespoke representatives or wealth management clients may have positions in securities discussed or mentioned in its published content.
Bespoke’s Weekly Sector Snapshot — 11/17/22
B.I.G. Tips – More Weakness in Housing
Highest Bullish Sentiment of the Year
As we noted last week, this week’s sentiment data is the first to encapsulate any reaction to last week’s CPI number as well as the subsequent market rally. Although price action has been somewhat choppy and there have been plenty of other catalysts (FTX’s collapse, more yield curve inversions, the missile strike in Poland) to balance out the inflation data and put investors back onto their heels, the latest AAII survey has shown a surge in bullish sentiment. The percentage of respondents reporting as optimistic jumped from 25.1% last week up to 33.5% this week. That is not only the largest one-week increase since the first week of June (when bulls rose by 12.2 percentage points) but is now the highest reading on bulls since the last week of 2021.
Bearish sentiment in turn dropped sharply falling to 40.2% for a decline of 6.8 percentage points. While an improvement, at the start of the month bearish sentiment had fallen by much more (both the last week of October and the first week of November saw double-digit week-over-week declines) and was at a much lower level of 32.9%.
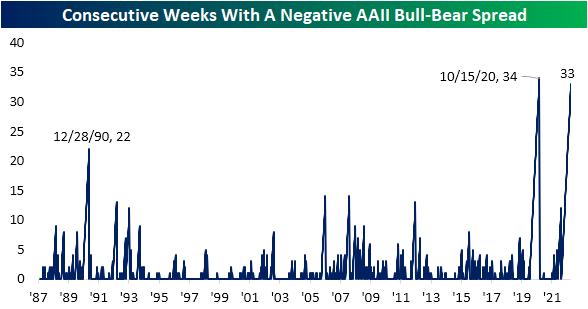
The bull-bear spread has narrowed but still remains negative for the 33rd week in a row. If the spread remains negative into next week, it will tie the record streak from 2020.
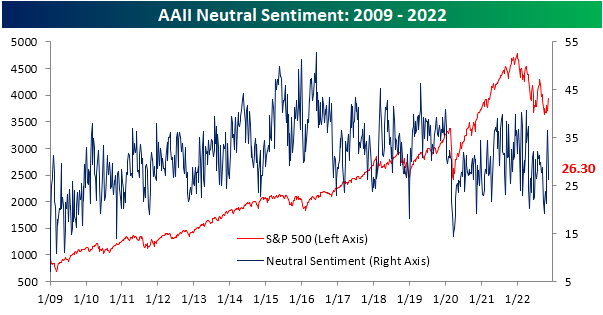
Neutral sentiment fell for a second week in a row with the total decline in that time eclipsing 10 percentage points. At 26.3%, it is down to the lowest level since the week of October 20th, implying that investors have become a bit more decisive in their respective market views.
The AAII survey’s more bullish turn this week was also seen in other readings on sentiment like the Investors Intelligence survey and the NAAIM Exposure Index. As a result, our sentiment composite which aggregates the findings of the three surveys into a single sentiment reading is back up to its highest reading since mid-August. Although the reading remains negative, it is no longer at the extreme levels that were common earlier this year. Click here to learn more about Bespoke’s premium stock market research service.
Chart of the Day: Put/Call Ratio Surges
Continuing Claims Rise For Five
Initial jobless claims were stronger than expected this week as the seasonally adjusted number came in at 222K versus expectations of a 3K increase to 228K. Last week’s reading was revised up slightly from 225K to 226K. At the current level, claims remain off their best levels from earlier this year but in the middle of the range since those lows. Although there has not been any clear further deterioration or improvement, the level of claims remains healthy in the range of readings that were typical of the pre-pandemic period.
On a non-seasonally adjusted basis, claims typically fall during the current week of the year. In fact, since the beginning of the data series, the comparable week of the year has only seen claims rise 16% of the time. That seasonal drop was again observed this year bringing the total count right below 200K which is below the readings of the comparable week for each year all the way back to 1969.
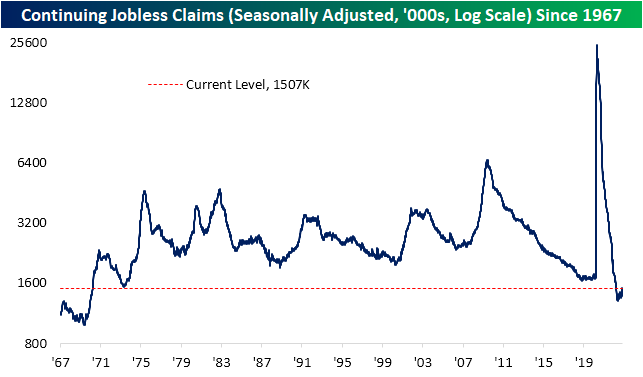
While initial claims are showing the labor market remains steadfast at historically healthy levels, continuing claims have been on the rise. For the first time since the end of March, seasonally adjusted continuing claims were above 1.5 million. Although that does not diminish just how low claims are (the reading would still need to rise another 142K to move back into the range of readings from the few years before the pandemic), they are now definitively trending higher.
With another weekly increase, it has now been five straight weeks in which continuing claims have risen. That long of a streak has been particularly uncommon in the post-financial crisis years. The only other example since 2009 was in the spring of 2020 when claims rose for 10 weeks in a row. Prior to that, these sorts of consistent increases in claims have more precedence with 28 other streaks reaching five weeks long or more. Additionally, we would note that the amount claims have risen (+134k) over this span is not particularly notable and is only 1.5K below the median increase in the first five weeks of each other streak. Click here to learn more about Bespoke’s premium stock market research service.


