Chart of the Day: Is Apple (AAPL) Cheap Yet?
Bespoke’s Morning Lineup – 1/5/23 – ADP and Jobless Claims Stronger Than Expected
See what’s driving market performance around the world in today’s Morning Lineup. Bespoke’s Morning Lineup is the best way to start your trading day. Read it now by starting a two-week trial to Bespoke Premium. CLICK HERE to learn more and start your trial.
“Yesterday’s home runs don’t win today’s games.” – Babe Ruth

Below is a snippet of content from today’s Morning Lineup for Bespoke Premium members. Start a two-week trial to Bespoke Premium now to access the full report.
Futures had reversed overnight lows and moved into positive territory earlier, but the stronger-than-expected ADP Private Payrolls report coupled with lower-than-expected jobless claims has pushed equities back in the red. Jobless claims were just released and also came in better than expected on both an initial and continuing basis, and that hasn’t helped the tone heading into the opening bell as the 10-year US Treasury yield has spiked up to 3.75%.
It was a close call but Santa did come this year as the S&P 500 posted a positive return during the seven trading day window (the last five trading days of one year and the first two of the next) when the Santa Claus Rally is said to occur. With a gain of 0.80%, though, it was a smaller-than-normal rally. As shown in the chart, that continues a trend of recent subdued returns during this period. In fact, the last time the S&P 500 rallied more than 2% during the Santa Claus Rally was back in 2013, and that ten-year drought without a 2% rally is the longest since at least 1953 when the five-day trading week on the NYSE in its current form began. Hey Santa, stop being such a cheapskate!

Our Morning Lineup keeps readers on top of earnings data, economic news, global headlines, and market internals. We’re biased (of course!), but we think it’s the best and most helpful pre-market report in existence!
Start a two-week trial to Bespoke Premium to read today’s full Morning Lineup.
Homebuilders Shrugging Off Mixed Data
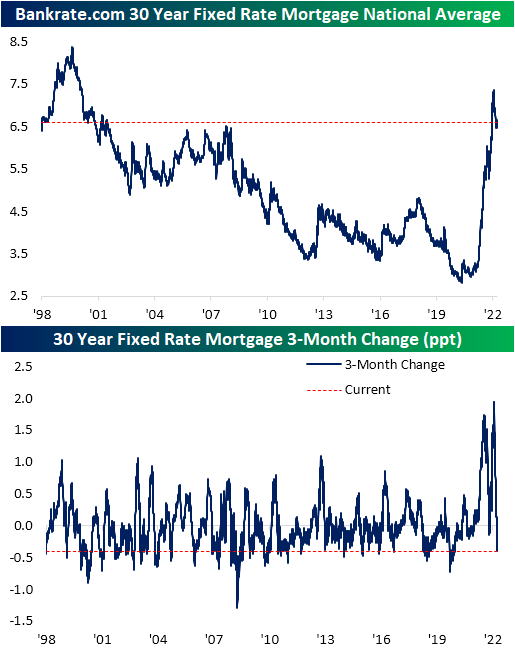
The national average for a 30-year fixed-rate mortgage has come well off its highs falling to 6.6% versus a high of 7.35% in early November. Despite the decline, mortgage rates remain at levels not seen since the early 2000s. We would also note that rates have gone on a series of wild swings in the past year. The second chart below shows the rolling 3-month change since 1998. Whereas most of the year saw rapid increases the likes of which have not been seen in the past quarter century, the current drop of 0.4 percentage points over the past few months has ranked as the largest since late 2020 and is just shy of a bottom decile reading of all periods.
With mortgage rates giving buyers some relief, purchase applications had generally been on the rebound throughout November and December. However, the final week of 2022 saw a large reversal in purchase apps with a 12% week-over-week decline (potentially as a result of residual holiday seasonality) in the largest single-week decline since the last week of September.

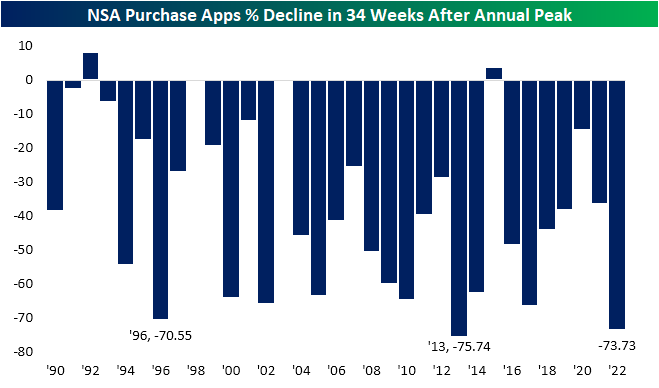
While it is hard to say if the final week of 2022’s large decline was seasonal or a return to purchase apps that are more consistent with readings from earlier in the fall, 2022 tended to follow seasonal patterns. The year began with applications around some of the strongest levels of the past decade and they continued to rise into peak housing season in the spring with applications hitting their pinnacle in the first week of May. The typical seasonal drift was then exacerbated by the added headwind of higher rates, and applications finished the year with the worst reading since 2014 for the comparable week of the year. Additionally, looking at the drop for each year from the annual high through 34 weeks later (second chart), 2022’s percentage drop was the second largest since 1990 behind only the 75.7% decline in 2013.

Refinance applications have continued to hit new lows as this week saw yet another decline down to the lowest level since May 2000.

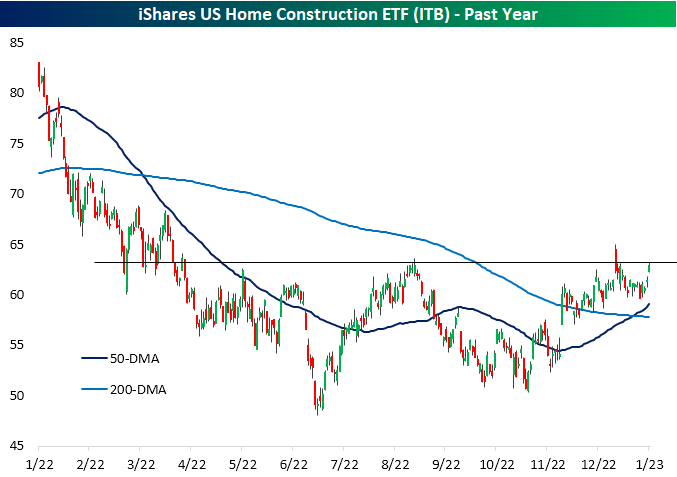
Even though there are some silver linings in recent data, housing activity remains weak. Homebuilder stocks continue to look past that though and continue to shrug off much of the broader market choppiness. The past week has seen the homebuilders, proxied by the iShares US Home Construction ETF (ITB), rally 3.25%. That has largely erased the mean reversion from the second half of December and brings the ETF right up to resistance at the mid-August highs. Click here to learn more about Bespoke’s premium stock market research service.
Daily Sector Snapshot — 1/4/23
Chart of the Day – Good Inflation News in ISM Manufacturing Report
Bespoke’s Morning Lineup – 1/4/23 – Energy and Rates Down, Stocks Up
See what’s driving market performance around the world in today’s Morning Lineup. Bespoke’s Morning Lineup is the best way to start your trading day. Read it now by starting a two-week trial to Bespoke Premium. CLICK HERE to learn more and start your trial.
“Yet we still live in a troubled and perilous world. There is no longer a single threat. There are many. They differ in intensity and in danger. They require different attitudes and different answers.”– Lyndon B Johnson
Below is a snippet of content from today’s Morning Lineup for Bespoke Premium members. Start a two-week trial to Bespoke Premium now to access the full report.
Investors are waking up to a bit of – dare we say it – goldilocks this morning as commodity prices and treasury yields are both lower and economic data out of Europe has been positive. Service sector PMIs for the Eurozone and each of the largest economies in the region have come in better than expected while some inflation-related reports have come in lower than estimates. Import Prices in Germany for the month of November dropped more than expected (-4.5% vs -1.6%) and French CPI for December unexpectedly declined. In response, futures are modestly higher heading into what is likely to be an eventful day with ISM Manufacturing and JOLTS at 10 AM, and the FOMC Minutes at 2 PM.
It wasn’t a particularly great year for financial assets anywhere across the spectrum in 2022. The only area to buck the trend was Energy. To start off 2023, though, Energy has been among the weakest areas as WTI opened the year with a decline of 3.9% on Tuesday (and is down an additional 3%+ this morning). With that decline, the Energy sector tumbled 3.5% (and is down another 1.5% in the pre-market).
The chart for WTI doesn’t look particularly encouraging. After making a lower high last June, the sector has been in a relatively consistent downtrend for more than six months, and a key trend since that peak has been multiple occurrences where the sector tried to rally back above its 50-DMA but failed. The last week has been the most recent example. After failing to take out its 50-DMA yesterday, WTI’s plunge yesterday was its largest decline to kick off a new year since 2007.

Even as oil prices have plunged from their 2022 highs, Energy stocks have held up impressively well. It was only back in mid-November that the Energy sector made a new high for the year while oil prices were well off their highs. Despite the outperformance, the sector’s technical picture has deteriorated. November’s peak was technically a higher high, but it’s starting to look more like a double-top. The fact that after trading below its 50-DMA in early December, the Energy sector has had multiple failed attempts to trade back above that level is a concern for longs. Like crude oil, Tuesday’s 3.6% decline was the weakest opening-day performance for the sector to start a year since 2007.

Our Morning Lineup keeps readers on top of earnings data, economic news, global headlines, and market internals. We’re biased (of course!), but we think it’s the best and most helpful pre-market report in existence!
Start a two-week trial to Bespoke Premium to read today’s full Morning Lineup.