Case-Shiller Shows Moderation In Home Price Growth
 As shown at left, home prices moderated somewhat in the month of February. This is in-line with declining new home prices. The Case-Shiller 20 City Home Price composite rose 66 bps MoM versus a 0.8% gain expected. On a YoY basis, the 20 City Composite is up 5.35% versus 5.50% expected and 5.75% last month. At left, we show the 3-month annualized rate of change for home prices on a national basis. A shown, while still close to the +10.23% pace recorded last month, price appreciation in the 20-city index has slowed somewhat. NYC metro home prices continue to lag, up 2.85% at an annual pace from November to February, while Seattle home prices continue to rip, up 18.59% annualized for the three month period ending February; that was the same pace as January.
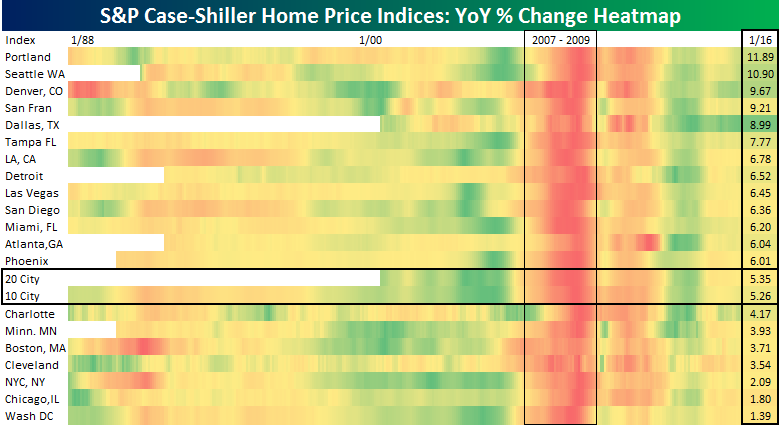
The heat map below color codes the YoY monthly changes in prices for each region in the Case-Shiller indices. Green shading represents periods where each city saw its strongest YoY growth relative to all other months while red shading indicates those months where each city showed the slowest growth. On a YoY basis, the housing market is without a doubt strongest in the West, with the Pacific Northwest cities of Portland and Seattle continuing to surge (the only two markets up by double digits YoY). Denver is also blistering, and despite oil price weakness, Dallas retained its above-average 9% YoY home price growth rate. Momentum has slowed in the Southeast with Atlanta and Charlotte both off recent highs in terms of price gains.
Start a 14-day no obligation free trial to see tonight’s Closer plus the rest of our research product.
Energy Driving High Yield Spreads Narrower
Along with the rally in equities that we have seen off the February lows, the rally in high-yield debt has been just as impressive. From the lows earlier this year, the Merrill Lynch High Yield Master II index of high-yield debt is up over 12% bringing its total return YTD up to 6.5%. With that rally, spreads have really narrowed falling from 887 bps over treasuries earlier this year to 632 as of Monday’s close.

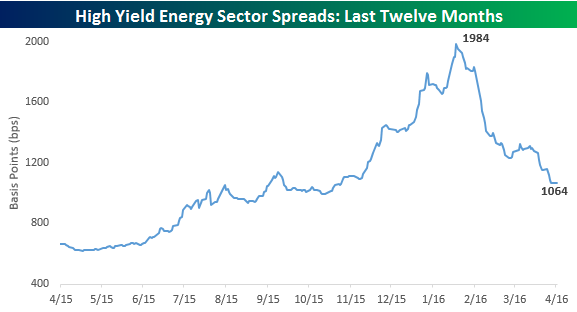
Obviously, the rally in this area of the debt market has been driven primarily by the rebound in Energy. Since the lows earlier this year, the Merrill Lynch index of high-yield energy has rallied close to 39% for a total YTD return of 12.5%. Over that time, spreads have compressed by nearly half, from just under 2,000 bps above treasuries to 1,064 bps above treasuries through yesterday. To put those levels from earlier this year into perspective, at the depths of the Financial crisis back in late 2008, the spread on the entire high yield master index peaked out at 2,147 bps. In that respect, the Energy sector has gone through its own version of a financial crisis over the last year.
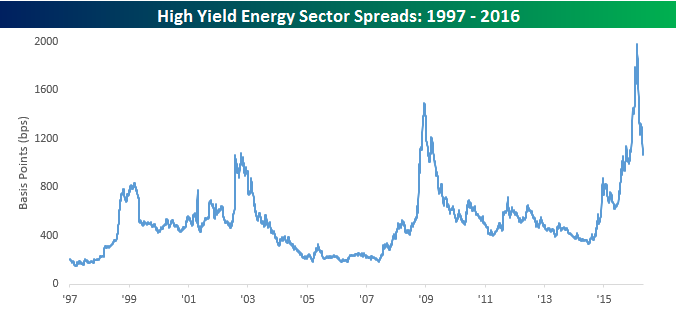
The chart below shows high yield spreads in the Energy sector on a long term basis going back to 1996. As mentioned above, spreads in the sector have nearly been cut in half over the last three months. In order to be fully cut in half spreads would need to narrow an additional 72 bps to 992. Looking at the chart, that kind of narrowing in spreads has been extremely uncommon.
ETF Trends: US Sectors & Groups – 4/25/16
Bespoke Stock Seasonality: 4/25/16
Price Reaction to Earnings Reports by Sector
Start a 14-day no obligation free trial to sample Bespoke’s premium research.
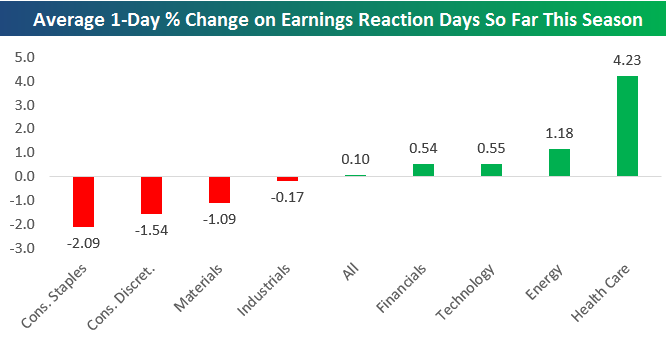
Through last Friday, 309 companies had reported earnings this season. Those 309 companies saw their stock prices move an average of 0.10% on the first trading day following their reports.
Below we break down the average price move on earnings this season by sector. As shown, Health Care stocks have seen huge gains on their earnings reaction days this season — averaging a gain of 4.23%. Energy stocks that have reported numbers have also done well with a one-day average gain of 1.18%.
Given big price drops for Tech stocks like IBM, Microsoft (MSFT), and Alphabet (GOOGL) after they reported earnings last week, the narrative has become that Tech is having a rough earnings season. In reality, though, the average Tech stock that has reported has gained 0.55% on its earnings reaction day.
On the downside, Consumer Staples and Consumer Discretionary stocks are getting hit hard in reaction to earnings this season. The average Consumer Staples stock has fallen 2.09% on its earnings reaction day, while the average Consumer Discretionary stock has fallen 1.54%. Let’s see if they can make a comeback over the remainder of the reporting period, which doesn’t end until mid-May. There’s certainly plenty of time left.
New Home Sales Miss As Supply Pressures Ease Slightly
Start a 14-day no obligation free trial to sample Bespoke’s premium research.
Today’s new home sales print missed expectations, coming in at a seasonally adjusted annual rate of 511,000 versus 520,000 expected. That miss was slightly offset by an upward revision to last month’s data, from 512,000 SAAR to 519,000 SAAR. Prices have also softened, falling 2% YoY and 6.4% MoM. Finally, we note that both months current supply (charted below) and median months on market (not shown) have risen, indicating looser new home markets across the country than we saw in recent months.

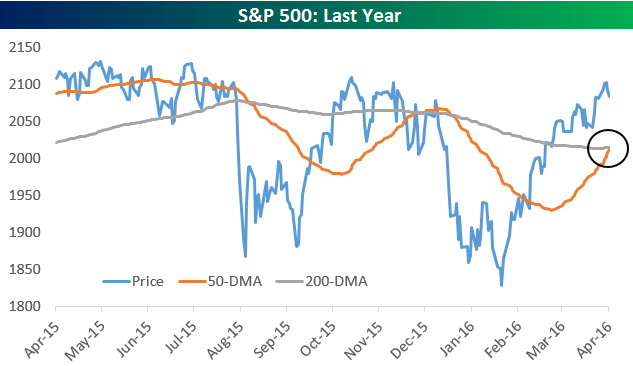
Chart of the Day: S&P 500 Golden Cross
While the S&P 500 is starting off the week on a down note this morning, it’s also experiencing a “golden cross” today. Remember, a “golden cross” is when the 50-day moving average crosses above the 200-day moving average as both moving averages are rising.
While the “golden cross” is meant to be interpreted as a bullish technical formation, the back-tested performance numbers for many stocks and indices in the weeks and months following a “golden cross” aren’t anything special. But how about for the S&P 500? There have only been 16 prior “golden crosses” for the S&P in the index’s history, so they’re very rare. The most recent came on October 22nd, 2010.
In today’s Chart of the Day sent to our paid research members, we look at the S&P 500’s performance in the week, month, three months, and six months following the 16 prior “golden crosses” in its history.
You can access today’s Chart of the Day by starting a 14-day no-obligation free trial to our paid research platform.
Bad and Badder
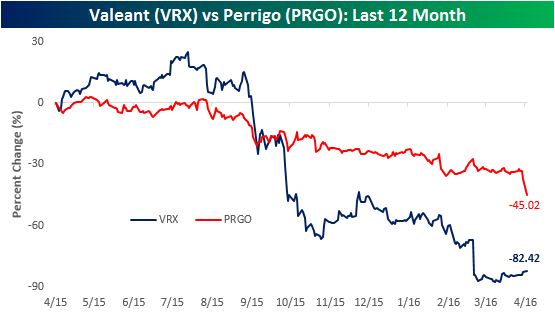
The big news out of the Health Care sector this morning is that the CEO of Perrigo (PRGO) is leaving and taking over at Valeant (VRX). On the news, shares of VRX are trading up 4% and PRGO is down over 12%. The performance of VRX over the last year has been an absolute disaster as the stock is down over 80%, so the fact that any CEO of a public company would be willing to leave their current role and step in and run VRX has been taken as a positive signal. Looking at the performance of PRGO over the last year, though, it too has been no slouch when it comes to big declines. As of this morning, the stock is down over 45% in the last year! To make matters worse, PRGO has also turned down numerous cash/stock overtures from Mylan (MYL) that the former CEO characterized as a “bad deal” for PRGO shareholders. Hindsight is always 20/20, but based on today’s prices, that bad deal for PRGO shareholders late last year would be worth over $185 per share compared to the current level of $105. That’s 75% above current levels.
Bespoke Brunch Reads: 4/24/16
Welcome to Bespoke Brunch Reads — a linkfest of the favorite things we read over the past week. The links are mostly market related, but there are some other interesting subjects covered as well. We hope you enjoy the food for thought as a supplement to the research we provide you during the week.
Real Estate
Why the Great Divide Is Growing Between Affordable and Expensive U.S. Cities (WSJ Real Time Economics)
Zoning regulations and available land are two of the key drivers that decided whether a city remains affordable and grows or gets expensive and doesn’t. [Link]
Developers Are Turning Rust Belt Hulks Into Luxury Hotels by Patrick Clark (Bloomberg)
Rust-belt architecture is being converted by hoteliers into youth-friendly attractions. [Link]
Amusements
A Congress of Robert Reichs by Rob Reich (Medium)
Put this in the “LOL” file, with little intellectual content. However, any time there are three notable people all with the same name at a single event, people tend to notice. [Link]
Celebrating 25 years: FRED birthday fun facts (The FRED Blog)
We use the Federal Reserve Economic Data service (FRED) daily to retrieve information about financial markets and the US economy, so we were thrilled to see the service note that it’s been around for 25 whole years with a list of “fun facts”. [Link]
Tech Origin Stories
The Real Story of How Amazon Built the Echo by Joshua Brustein (Bloomberg)
The inside story on one of the most unusually loved tech devices to be released in recent years. [Link]
The Untold Story of Magic Leap, the World’s Most Secretive Startup by Kevin Kelly (Wired)
Another development story, this time taking place in unlikely Southern Florida. Magic Leap is a start-up focused on creating lenses which can augment reality and be used to turn every situation into a way to interact with machines in a new and innovative way. [Link]
I Have No Idea What This Startup Does and Nobody Will Tell Me by Sam Biddle (Gawker)
Helena appears to be some kind of foundation…or is it a company? Are the celebrities and high-profile “influencers” it claims really associated with it? Read on, this was a fascinating story. [Link]
Millennial Demographics
Shut Up About Harvard by Ben Casselman (538)
Most US students do not go to hyper-competitive undergraduate schools. While the media focuses on a narrative that obsesses over admittance rates at a few elite colleges, less than 4% of US undergrads attend schools that accept 25% or fewer of their applicants. [Link]
Americans are becoming more socially liberal — except when it comes to divorce by Catherine Rampell (Washington Post)
In an era when only men were socially permitted to earn income outside the home and retirement income was most likely to come from children, marriage was probably best described as a mutual investment. Now, it’s probably best described as consumption. [Link]
The Average 29-Year-Old by Derek Thompson (The Atlantic)
We love this piece, which knocks down a series of absurd assumptions made by the media and the culture at large about who Millennials are. [Link]
Office Perks Are Dumb by Rebecca Greenfield (Bloomberg)
Are free beer, snacks, and ping pong a way to attract the best workers or just a strategy to pay them much less? [Link]
Emerging Markets
Mr. Erdogan Will See You Now: Welcome to Banking’s Toughest Job by Onur Ant (Bloomberg)
The Central Bank of Turkey governor has gotten increasingly creative trying to keep the currency and rest of the macroeconomic landscape stable. So of course he has been fired. [Link]
Goldman Sachs: Firming Fundamentals for Emerging Markets Will Prove Fleeting by Luke Kawa (Bloomberg)
Emerging markets equities have had a fantastic run, but Goldman Sachs’ research suggest a short-term bounce has been driven by macro factors. [Link]
Big Profiles
The $2 Trillion Project to Get Saudi Arabia’s Economy Off Oil by Peter Waldman (Bloomberg)
A fantastic interview covering the man responsible for a historic economic and social shift, one of the largest in the world. [Link]
The Secret History of Tiger Woods by Wright Thompson (ESPN)
Deep inside the rise and fall of Tiger’s game and the unique twists and turns he has experienced in the rise to greatness and commensurate fall. [Link]
Big Ideas
Musk’s Secret Plan to Curb City Traffic With Self-Driving ‘Bus’ by Marie Mawad (Bloomberg)
After dreaming up the Hyperloop and continuing to roll out electric cars at present, the Tesla founder isn’t satisfied. We can’t say we’re surprised. [Link]
Can Sean Parker Hack Cancer? by Clifton Leaf (Fortune)
The Napster founder and early VC for Facebook is trying to fund and organize a revolutionary effortto reduce death from cancer. [Link; autoplays video]
Turning Cycles
On the Road to Recap: Why The Unicorn Financing Market Just Became Dangerous…For All Involved by Bill Gurley (Above the Crowd)
A summary of the general conditions and general outlook in tech VC at the moment. [Link]
This Short Seller Has Raised $100 Million to Bet Against a Single Stock (Reuters for Fortune)
Kerrisdale Capital, a small hedge fund based out of New York, is short $100mm worth of a single stock. We can’t blame him for being secretive about it. [Link]
More
A Wine Mogul Says Fidelity Cheated Him Out of Millions by Neil Weinberg (Bloomberg)
Conflicts of interest, Chinese companies, and 9 figure law suits abound in this tick-tock covering the painful blow up between Fidelity and Peter Deutsch. [Link]
Amazon Doesn’t Consider the Race of Its Customers. Should It? By David Ingold and Spencer Soper (Bloomberg)
Rapid delivery via Amazon Prime Now is widely available in American cities…but often not in areas that have mostly minority residents. [Link]
Start a 14-day no obligation free trial to sample Bespoke’s premium research. Our Bespoke Report newsletter sent to paid members every Friday is a great read if you’re looking for additional weekend reading.
The BESPOKE REPORT — 4/22/16
Each week, Bespoke sends clients across all of its subscription levels the Bespoke Report newsletter. If you’re looking for Bespoke’s analysis of current market internals, economic data, earnings beats and misses, individual stock ideas, and more, the Bespoke Report has it all. If you sign up for a subscription between now and Sunday, you’ll receive a 20% discount for the life of your membership! Simply choose one of the offerings below to gain access to some of the best research you’ll find anywhere. Here’s a matrix of the products included with each level of service.
Newsletter Annual – $316/yr (20% off)
Newsletter Monthly – $39/mo (20% off)
Premium Annual – $795/yr (20% off)
Premium Monthly – $79/mo (20% off)
Institutional Annual – $1595/yr (20% off)
Institutional Monthly – $155/mo (20% off)
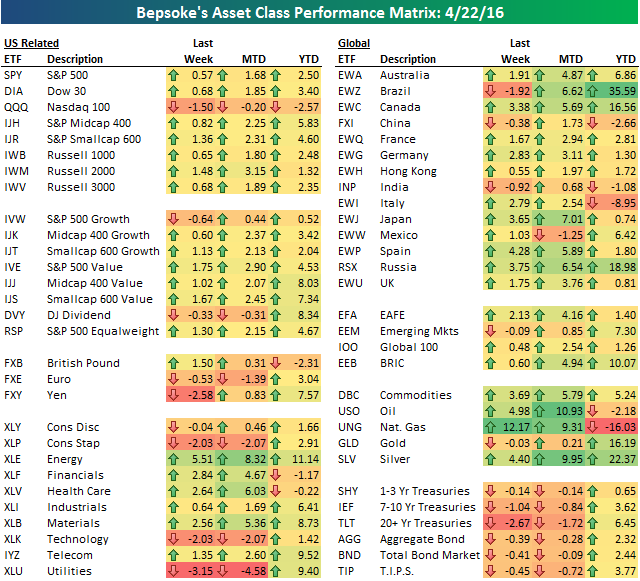
Below is a look at our asset class performance matrix using key ETFs traded on US exchanges. The S&P 500 (SPY) ETF traded up 0.57% this week — not much, but at least it wasn’t in the red like the Nasdaq 100 (QQQ). The Tech-heavy Nasdaq fell 1.5% due to negative earnings reports from high-profile names like Alphabet (GOOGL), Netflix (NFLX) and Microsoft (MSFT). QQQ is now underperforming SPY by more than 500 basis points year-to-date.
Looking at the ten sectors, we saw defensive areas get hit hard, while Energy, Financials, Health Care and Materials posted nice gains. Outside of the U.S., Brazil and India were the only countries in the red for the week, which left the Emerging Markets ETF (EEM) in the red as well. Commodities saw big jumps with the exception of gold, while Treasury ETFs were down across the board.
Have a great weekend!