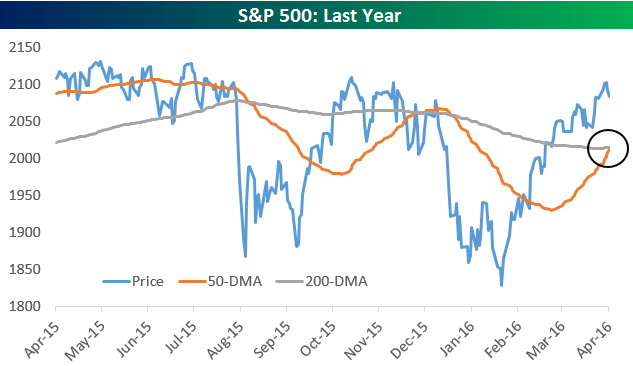
While the S&P 500 is starting off the week on a down note this morning, it’s also experiencing a “golden cross” today. Remember, a “golden cross” is when the 50-day moving average crosses above the 200-day moving average as both moving averages are rising.
While the “golden cross” is meant to be interpreted as a bullish technical formation, the back-tested performance numbers for many stocks and indices in the weeks and months following a “golden cross” aren’t anything special. But how about for the S&P 500? There have only been 16 prior “golden crosses” for the S&P in the index’s history, so they’re very rare. The most recent came on October 22nd, 2010.
In today’s Chart of the Day sent to our paid research members, we look at the S&P 500’s performance in the week, month, three months, and six months following the 16 prior “golden crosses” in its history.
You can access today’s Chart of the Day by starting a 14-day no-obligation free trial to our paid research platform.