Chart of the Day: AAPL = IEI
Bullish Sentiment Declines Again
Once again this week, the latest sentiment survey from the American Association of Individual Investors (AAII) showed that investors want nothing to do with this market. In the latest week, as the S&P 500 came within 1% of its all-time closing high, bullish stock market sentiment is just barely hanging on to the 20% level. As shown in the chart below, in this week’s survey, bullish sentiment dropped from 22.33% down to 20.41%. Once again, that’s the lowest weekly reading since February 11th when the S&P 500 was 10%+ lower. This week’s reading also marks the 28th straight week and the 62nd week in the last 63 where bullish sentiment was below 40%.
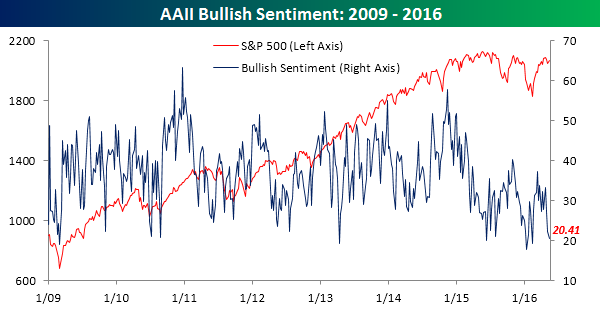
Although bullish sentiment is right near its lows for the year, bearish sentiment is not spiking. In this week’s survey, bearish sentiment increased from 30.34% up to 31.29% and is nowhere near the high 40% range we saw back in January.

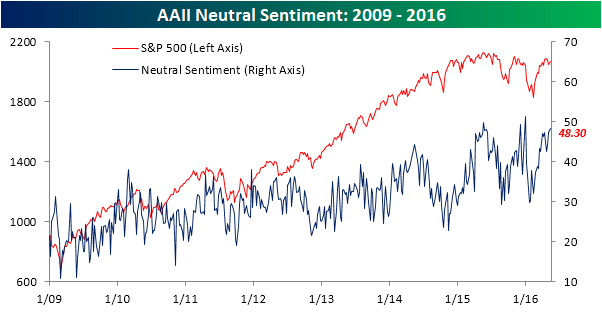
That leaves us with the neutrals. In this week’s survey, neutral sentiment increased to 48.3%. Looking at the chart below, this is the third period in the current cycle where neutral sentiment has reached such lofty levels. Interestingly enough, the prior two periods were in May and December 2015, which also happen to be the two other times when the S&P 500 was flirting with 2,100. It seems as though at these price levels, investors don’t necessarily want to be bearish, but they are also finding it tough to find reasons to justify a bullish posture.
the Bespoke 50 — 5/12/16
Jobless Claims Join the List of 52-Week Highs
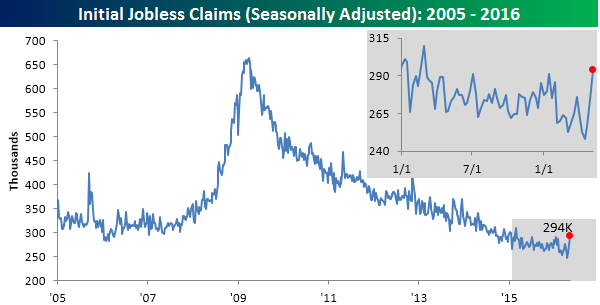
Today’s report on initial jobless claims was just plain bad. While economists were expecting claims to come in at a level of 270K, the actual reading was 24K higher at 294K. This was the highest weekly reading in claims in over a year (February 2015) and also the biggest miss relative to expectations since March 2015. Not only was this a big increase relative to last week, but it also comes on the heels of a relatively big increase in the prior week (+17K). On a combined basis, jobless claims have now risen by 37K over the last two weeks, which is the largest two-week increase in more than two years (April 2014). The next milestone to watch is the 300K level, which hasn’t been breached to the upside since March 2015 (62 weeks).
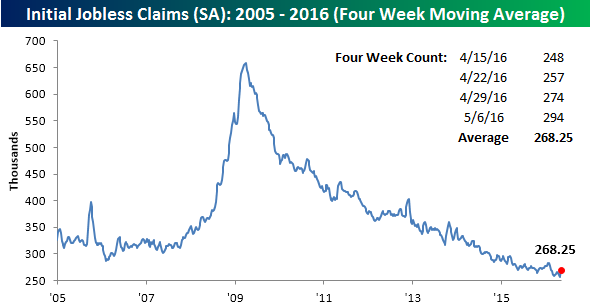
Given the increases in the last two weeks combined with the relatively low readings that dropped off of the count, the four-week moving average for claims rose by over 10K this week to 268.25K. Two weeks ago, the four-week moving average made a multi-decade low, and after the last two weeks, that level may be in place for a long time.
On a non-seasonally adjusted (NSA) basis, claims rose by 18.3K to 261.8K. While we have often cited the fact that NSA claims were at their lowest levels in decades, for the current week of the year they were actually lower last year. That being said, this week’s reading was still 74K below the average reading of 336K for the current week of the year dating back to 2000.

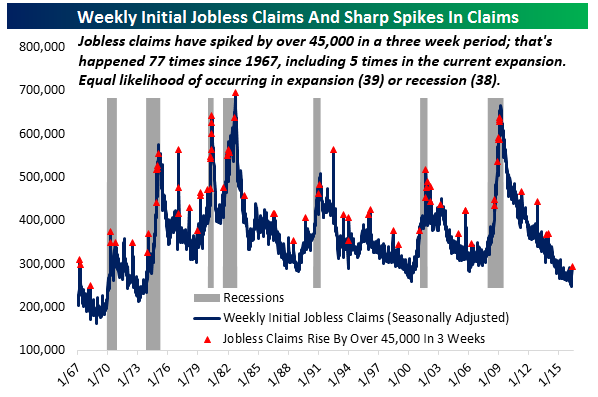
Finally, from their cycle low of 248K three weeks ago, jobless claims have now risen by 45K. While this is a very big increase relative to the last several weeks, we would note that it is hardly a rare occurrence. As shown in the chart below, since 1967 initial claims have risen by 45K or more over a three-week period 77 times, including five occurrences in the current economic expansion. Also, as far as this kind of increase being an indicator of recession or not, 38 have occurred during recessions, while 39 have been during periods of growth. That being said, the amount of time that the economy has been in a recession is considerably less than the amount of time it has been in an expansion, so as a share of total weeks, these kind of spikes are much more common in recessions.
Bespoke’s Top Stocks Under $10 — 5/11/16
We’ve just published our newest list of the top mid-cap and small-cap stocks under $10. The 20 names featured have positive valuations/fundamentals as well as attractive price charts. We started with a list of all stocks under $10/share in the Russell 3,000 and then began filtering based on a number of fundamental and technical criteria. To be included on the list, the stock must also have a market cap greater than $200 million but less than $5 billion and average volume of more than 200,000 shares/day.
The list of stocks has broad sector representation, with eight of ten sectors included (there are no Consumer Staples or Utilities stocks). Five Energy stocks that have recently begun trending higher after experiencing severe downtrends are on the list, and four Technology stocks are included as well. On pages two through six of the report, we provide one-year price and volume charts for each stock, and we also provide a company description. The purpose of this list is to provide clients that may be looking for new small-cap and mid-cap opportunities with a basket of names to do additional research on. It is not meant to be a model portfolio or blanket buy list, and any allocation into any of the names should have a very minimal weighting. We also recommend using a stop loss of 10-15% below entry price for all of the names to limit downside exposure.
Sign up below to proceed to our newest list of the top stocks under $10.
See Bespoke’s “Top Stocks Under $10” by signing up for a monthly Bespoke Premium membership now. Click this link for a 14-day free trial.
Keeping Track of Fixed Income
If you manage fixed income investments or have them as part of your portfolio as most investors do, you may have a hard time keeping track of what’s going on across the extremely large and diverse universe of fixed income products. To help, we publish our Fixed Income Weekly on Wednesdays to Bespoke Institutional subscribers. The 6-page report features a page of ad hoc commentary on topics related to fixed income, charts of major fixed income returns, yields, prices, and spreads, and a weekly update on a variety of yield curves including the Bespoke Global Yield Curve, our PPP-GDP weighted benchmark for the 15 largest local currency bond markets. We also summarize fixed income trends via ETF performance. This week’s ETF grid is presented below. Recent performance has been driven by duration, with long-term corporates and Treasuries outperforming. Since bottoming in February high yield bonds and bank loans have also done well on a total return basis. The only way to lose so far in 2016? Being short. Inverse ETFs that short Treasuries are deep in the red.
