ETF Trends: US Sectors & Groups – 7/13/16
Below is our daily list of the twenty best and twenty worst performing ETFs over the last five trading days. Many of the top performers are down from yesterday’s high water marks, including Steel Producers, Metals & Mining, and FX-hedged Japanese equities, but they continue to sit in the top 3 positions on a weekly basis. Many of the long-term treasury and bond exposures inched up slightly from yesterday but were still negative over the past five days. Likewise, gold rose slightly on the day but remained among the worst performers on the week. Semiconductors turned in a very strong performance on both a daily and weekly basis.

Bespoke provides Bespoke Premium and Bespoke Institutional members with a daily ETF Trends report that highlights proprietary trend and timing scores for more than 200 widely followed ETFs across all asset classes. If you’re an ETF investor, this daily report is perfect. Sign up below to access today’s ETF Trends report.
See Bespoke’s full daily ETF Trends report by starting a no-obligation free trial to our premium research. Click here to sign up with just your name and email address.
B.I.G. Tips — What Would Private Equity Do? Update
On January 22, we distributed a B.I.G. Tips report to our paid subscribers called, “WWPED (What Would Private Equity Do?” In that report, we looked through the carnage in equity markets to find beaten down value names that could be attractive targets to the private equity world. We noted that while private equity firms can have widely divergent strategies, they often look for some key characteristics: under-performing companies and significant free cash flow potential. Using that as a guide, we sorted through the Russell 1,000 for companies that were then trading at 10x or less on a “TEV / (EBITDA – Capex)” basis, which is a good proxy for valuation relative to cash flow. We found 39 names that met our criteria and highlighted three in particular (URBN, GNC and GMRE) in that report.
Yesterday, we updated that screen and sent it to Bespoke Premium and Bespoke Institutional members. The updated report looks at the performance of our original WWPED list of stocks and identified some new stock ideas after updating the screen for current market pricing. To get the full report, please sign up for a paid membership below!
See the full B.I.G. Tips report by signing up for a monthly Bespoke Premium membership now. Click this link for a 10% discount ($89/month).
Biotech Still Stuck in Downtrend
The Nasdaq Biotech Index has rallied more than 10% off its post-Brexit lows, but as shown in the one-year chart of the group below, it still can’t get above resistance at the top of its steep downtrend channel. The fact that the group made a “lower low” during the Brexit sell-off is another discouraging sign from a technical standpoint.

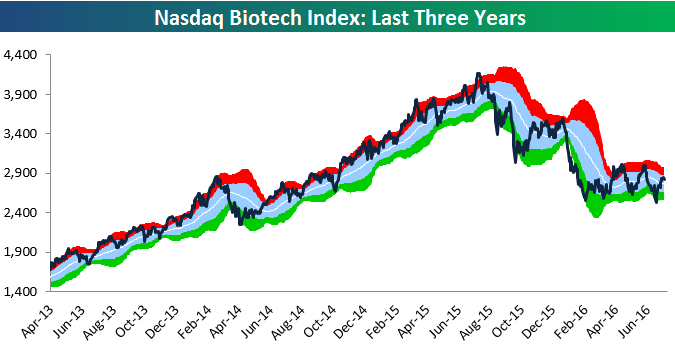
A longer-term (3 years) chart of the Biotech group below provides an additional snapshot of how painful the descent has been over the last year.
S&P 500 Sector Trading Range Charts
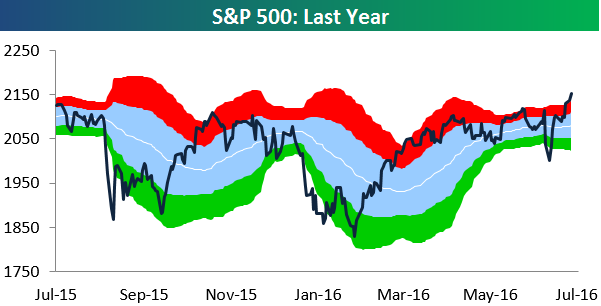
The S&P 500 has broken out nicely here, but we’d like to see it hold above these levels for at least a couple of weeks.
Over the last couple of months, we noted a number of times how tight the S&P’s trading range had become due to low volatility. You can see how tight the range had gotten in the chart below. For reference, the light blue shading below represents between one standard deviation above and below the S&P’s 50-day moving average. When trading ranges tighten up like this, the presumption is that the eventual breakout will be a big one. In this instance, we saw a pump-fake break lower on the Brexit news followed by a huge rally that has now caused an upside breakout. At this point, the upside breakout could still prove to be another pump fake just like the break lower was a couple of weeks ago. That’s why we said earlier that we’d like these new highs hold for at least a couple of weeks before sounding the all clear.
Below we provide one-year trading range charts for the ten S&P 500 sectors. At this point, Industrials is the only cyclical sector to make a new high like the S&P 500. Consumer Discretionary is the next closest to a new high, but other cyclicals like Technology, Financials, and Materials still have some work to do.
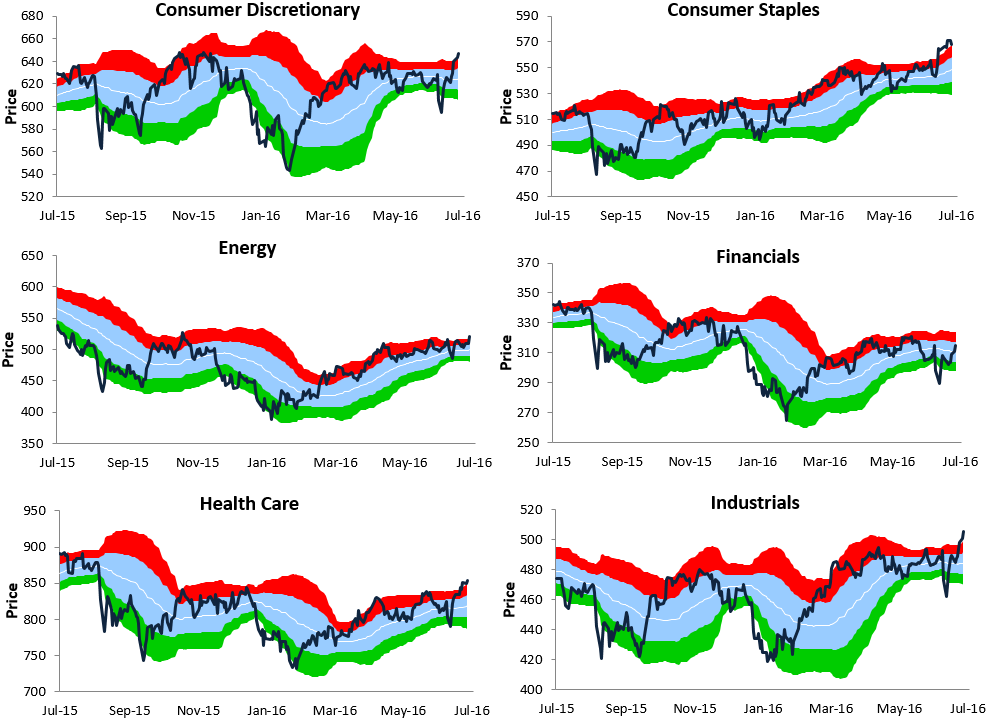
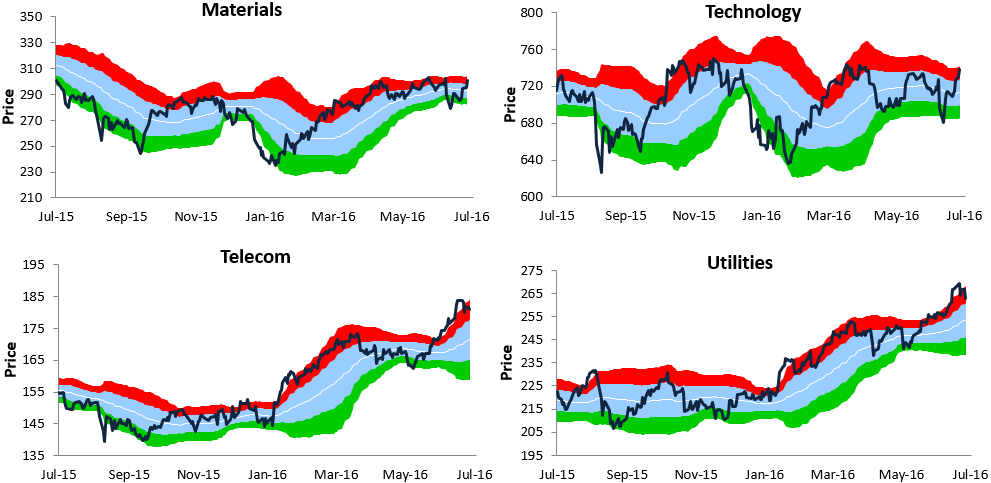
Chart of the Day – Global Benchmark A/D Line Surges to Three Year High
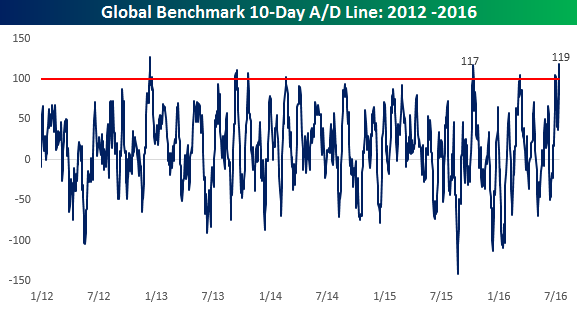
Just about a month ago , when equities were selling off leading up to the 6/23 UK referendum, we published a B.I.G. Tips report (A Global Flush – clients only) highlighting how the four-day advance/decline (A/D) reading in our International Benchmark Breadth Indicator had reached one of its most negative levels of the last ten years. Given the rally in global equities over the last two weeks, we wanted to update this indicator to see how the recent breadth of global equities compares to other periods.
For those unfamiliar with this indicator, our International Benchmark Breadth Indicator tracks the daily changes (in local currency terms) of the benchmark stock indices for the 25 largest economies in the world. As shown in the chart below, through yesterday’s close, the 10-day A/D reading spiked to +119, exceeding the high of +117 from last October for the most positive breadth reading since December 2012.
In today’s Chart of the Day sent to paid subscribers, we take a look at how the S&P 500 performed following prior instances going back to 1998 where the International Benchmark Breadth Indicator reached similar or higher levels. If you are wondering how to approach the market following the monumental rally of the last ten trading days, you need to see this report. To view it, please start a 14-day free trial below.
Bespoke’s Country Trading Range Screen
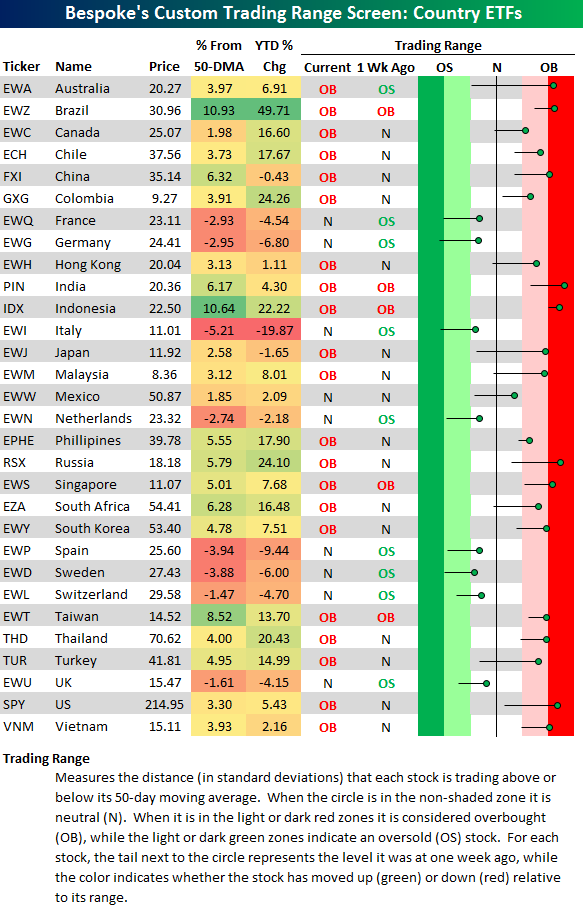
Below is a look at our trading range screen for the 30 largest country ETFs traded on US exchanges. A week ago at this time, more country stock markets were oversold than overbought, but the picture looks a lot better now. At the moment, 21 of 30 countries are in overbought territory, while the remaining 9 are in neutral territory. (A description of how to read the screen is provided below the last ETF listed.)
Nine of 30 countries are trading in extreme overbought territory. This means that they’re more than two standard deviations above their 50-day moving averages. The US (SPY) is one of the most overbought markets in the world right now, so it wouldn’t be surprising to see a short-term cool-off period here. If you’re looking for new ideas on the long side, you can use this screen to find countries that have upside momentum but aren’t yet trading at overbought levels. Some examples in the screen below include Canada (EWC), Mexico (EWW), and all of the Western Europe ETFs that have just moved out of oversold territory but have yet to re-take their 50-day moving averages (the black vertical “N” line).
Dynamic Upgrades/Downgrades: 7/13/16
S&P 500 Sector Breadth Levels Strong
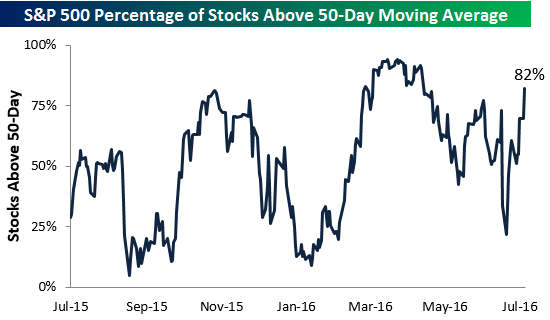
With the S&P 500 making a new all-time high this week, below is a check-up on underlying breadth as measured by the percentage of stocks trading above their 50-day moving averages. As shown, 82% of S&P 500 index members are currently above their 50-days. That’s a very strong reading that’s indicative of a market firing on all cylinders. Back in late March/early April, breadth was even stronger than it is now. 2015 was a year that saw extreme weakness in breadth levels even when the market was hitting new highs. Ultimately we saw two significant corrections in late 2015 and early 2016. Since the lows were reached in February, however, we’ve seen breadth surge above 80% twice, and we also made a “higher low” in breadth during the “Brexit” correction a couple of weeks ago.
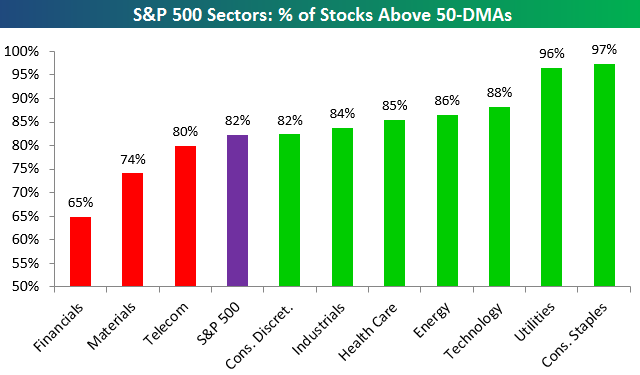
Notably, seven of ten underlying S&P 500 sectors have breadth readings that are currently stronger than the reading for the broad index. Two defensive sectors — Consumer Staples and Utilities — still have the highest readings, but Technology, Energy, Health Care and Industrials are all cyclical sectors that have seen bullish increases in breadth lately. The only big sector that has a weaker-than-market reading is Financials, which currently has 65% of its stocks above their 50-days. Later this week we’ll get Q2 earnings reports for a number of big Financial firms in the S&P, which will hopefully provide some insights into how the sector will act in the coming weeks and months.
The Closer 7/12/16 – JOLTed Yields
Looking for deeper insight on global markets and economics? In tonight’s Closer sent to Bespoke clients, we go deeper into the JOLTS data reported today and also take a close look at prior “shocks” to the US ten year yield, with a summary of the implications for both the bond and equity markets. We also preview a busy night ahead for data and Fed speakers as well as US data due out tomorrow.

The Closer is one of our most popular reports, and you can sign up for a trial below to see it and everything else Bespoke publishes free for the next two weeks!
Click here to start your no-obligation free Bespoke research trial now!
B.I.G. Tips – Historic Rebound
Back on June 28th, we published a B.I.G. Tips report (clients only) looking at the extent of the two-day sell off following the Brexit vote and how it had reached historic levels on a short-term basis. In that report, we provided an analysis of how the S&P 500 performed following prior periods of extreme oversold readings and noted that forward returns were positive. While the magnitude of the positive returns we highlighted was not as strong as what we have seen in the last two weeks, the direction was the same.
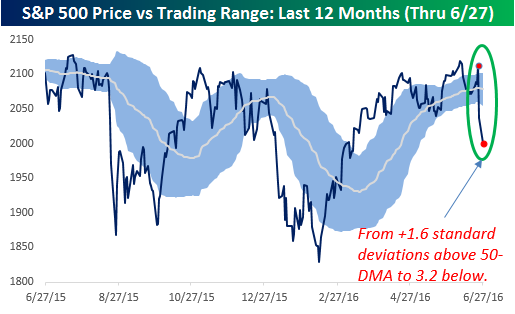 One chart we included from that report on 6/28 showed the S&P 500’s trading range as measured by standard deviations that the index was closing above or below its 50-day moving average (DMA). For reference, anything within one standard deviation is considered a ‘normal’ level, while anything more than one standard deviation above (below) is considered overbought (oversold). The chart showed that the S&P 500 went from 1.6 standard deviations above its 50-DMA to 3.2 standard deviations below in the span of two trading days. In the history of the index dating back to 1928, that was the most extreme two-day move on record.
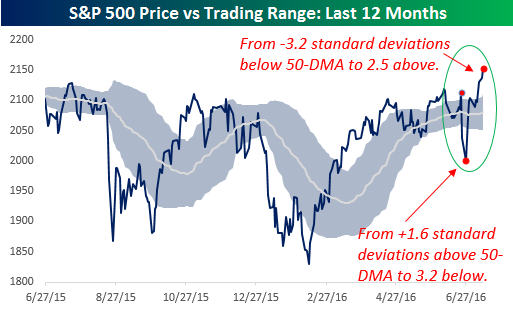 So what has happened since then? The second chart to the right is updated through 7/12. In the ten trading days since then, the S&P 500 has gone from 3.2 standard deviations below its 50-DMA to 2.5 standard deviations above.
We just sent out a B.I.G. Tips report to Bespoke Premium and Bespoke Institutional members, which provided an analysis of prior periods where the S&P 500 saw similar shifts from extreme oversold to extreme overbought and how equities performed going forward. To get the full report, sign up.
See the full B.I.G. Tips report by signing up for a monthly Bespoke Premium membership now. Click this link for a 10% discount ($89/month).