Just about a month ago , when equities were selling off leading up to the 6/23 UK referendum, we published a B.I.G. Tips report (A Global Flush – clients only) highlighting how the four-day advance/decline (A/D) reading in our International Benchmark Breadth Indicator had reached one of its most negative levels of the last ten years. Given the rally in global equities over the last two weeks, we wanted to update this indicator to see how the recent breadth of global equities compares to other periods.
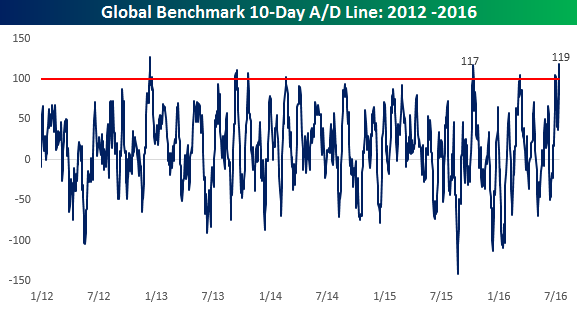
For those unfamiliar with this indicator, our International Benchmark Breadth Indicator tracks the daily changes (in local currency terms) of the benchmark stock indices for the 25 largest economies in the world. As shown in the chart below, through yesterday’s close, the 10-day A/D reading spiked to +119, exceeding the high of +117 from last October for the most positive breadth reading since December 2012.
In today’s Chart of the Day sent to paid subscribers, we take a look at how the S&P 500 performed following prior instances going back to 1998 where the International Benchmark Breadth Indicator reached similar or higher levels. If you are wondering how to approach the market following the monumental rally of the last ten trading days, you need to see this report. To view it, please start a 14-day free trial below.
